GE 2006 Annual Report Download - page 28
Download and view the complete annual report
Please find page 28 of the 2006 GE annual report below. You can navigate through the pages in the report by either clicking on the pages listed below, or by using the keyword search tool below to find specific information within the annual report.-
 1
1 -
2
-
3
-
4
-
5
-
6
-
7
-
8
-
9
-
10
-
11
-
12
-
13
-
14
-
15
-
16
-
17
-
 18
18 -
 19
19 -
 20
20 -
 21
21 -
 22
22 -
 23
23 -
 24
24 -
 25
25 -
 26
26 -
 27
27 -
 28
28 -
 29
29 -
 30
30 -
 31
31 -
 32
32 -
 33
33 -
 34
34 -
 35
35 -
 36
36 -
 37
37 -
 38
38 -
39
-
40
-
41
-
42
-
43
-
44
-
45
-
46
-
47
-
48
-
49
-
50
-
51
-
52
-
53
-
54
-
55
-
56
-
57
-
58
-
59
-
60
-
61
-
62
-
63
-
64
-
65
-
66
-
67
-
68
-
69
-
70
-
71
-
72
-
73
-
74
-
75
-
76
-
77
-
78
-
79
-
80
-
81
-
82
-
83
-
84
-
85
-
86
-
87
-
88
-
89
-
90
-
91
-
92
-
93
-
94
-
95
-
96
-
97
-
98
-
99
-
100
-
101
-
102
-
103
-
104
-
105
-
106
-
107
-
108
-
109
-
110
-
111
-
112
-
113
-
114
-
115
-
116
-
117
-
118
-
119
-
120
 |
 |

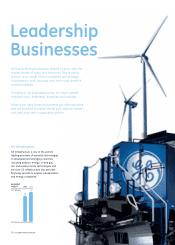
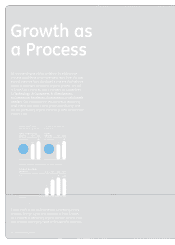
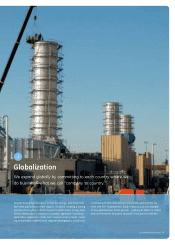
Growth as
a Process
GE is extending its ability to deliver by adding new
process capabilities to our operating rigor. Over the past
several years we have developed a process that fuels our
ability to generate consistent organic growth. We call
it Growth as a Process, and it includes six capabilities:
1) Technology, 2) Customers, 3) Globalization,
4) Commercial Excellence, 5) Innovation and 6) Growth
Leaders. Our investment in this process is delivering
total assets and orders have grown signifi cantly, and
we are generating organic revenue growth at twice our
historic rate.
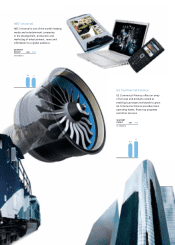
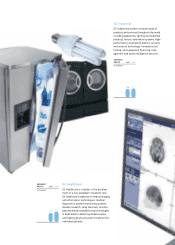
Today, each of our six businesses is investing in this
process. Energy is just one example of how Growth
as a Process is delivering organic growth. Here is how
this process is bringing value to this specifi c business.
TOTAL CONTINUING
ASSETS
(In $ billions)
2005
480
2006
565
Growth
18%
TOTAL
ORDERS
(In $ billions)
2005
74
2006
90
Growth
21%
Sparking growth in our
fi nancial services businesses …
… as well as our industrial
businesses.
2006
9
2005
8
History
4
2007*
2-3X
GDP
ORGANIC REVENUE
GROWTH
(V%)
*Forecast
Delivering consistent growth through the whole company.
26 ge 2006 annual report