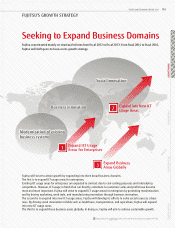
Fujitsu 2014 Annual Report Download - page 17
Download and view the complete annual report
Please find page 17 of the 2014 Fujitsu annual report below. You can navigate through the pages in the report by either clicking on the pages listed below, or by using the keyword search tool below to find specific information within the annual report.-
 1
1 -
2
-
3
-
4
-
5
-
6
-
 7
7 -
 8
8 -
 9
9 -
 10
10 -
 11
11 -
 12
12 -
 13
13 -
 14
14 -
 15
15 -
 16
16 -
 17
17 -
 18
18 -
 19
19 -
 20
20 -
 21
21 -
 22
22 -
 23
23 -
 24
24 -
 25
25 -
 26
26 -
 27
27 -
28
-
29
-
30
-
31
-
32
-
33
-
34
-
35
-
36
-
37
-
38
-
39
-
40
-
41
-
42
-
43
-
44
-
45
-
46
-
47
-
48
-
49
-
50
-
51
-
52
-
53
-
54
-
55
-
56
-
57
-
58
-
59
-
60
-
61
-
62
-
63
-
64
-
65
-
66
-
67
-
68
-
69
-
70
-
71
-
72
-
73
-
74
-
75
-
76
-
77
-
78
-
79
-
80
-
81
-
82
-
83
-
84
-
85
-
86
-
87
-
88
-
89
-
90
-
91
-
92
-
93
-
94
-
95
-
96
-
97
-
98
-
99
-
100
-
101
-
102
-
103
-
104
-
105
-
106
-
107
-
108
-
109
-
110
-
111
-
112
-
113
-
114
-
115
-
116
-
117
-
118
-
119
-
120
-
121
-
122
-
123
-
124
-
125
-
126
-
127
-
128
-
129
-
130
-
131
-
132
-
133
-
134
-
135
-
136
-
137
-
138
-
139
-
140
-
141
-
142
-
143
-
144
-
145
-
146
-
147
-
148
-
149
-
150
-
151
-
152
-
153
-
154
-
155
-
156
-
157
-
158
-
159
-
160
-
161
-
162
-
163
-
164
-
165
-
166
-
167
-
168
 |
 |

0
200
800
400
600
2010 20122011 2013 2014
2.0
1.5
1.0
0.5
0
519.6
577.4 534.9
381.1
470.8
0.72 0.86
0.57 0.45
0.91
0
150
50
100
2010 20122011 2013 2014
122.2
126.4 121.7
140.6
130.2
0
12
6
3
9
2010 20122011 2013 2014
4
8
5
1010
0
300
100
200
2010 20122011 2013 2014
221.3
224.9 231.0
238.3236.2
9.0
6.0
3.0
0
4.8 4.6
5.3
5.2 5.3
(¥ Billions) (Times)
(¥ Billions) (Yen)
(¥ Billions) (%)
(As of March 31)
(Years ended March 31) (Years ended March 31)
(Years ended March 31)
Interest-bearing loans (left scale)
D/E ratio (right scale)
R&D expenses (left scale)
Ratio to net sales (right scale)
0
50
200
150
100
131.3
101.4
109.8
118.5
2010 20122011 2013 2014
94.8
0
1.0
2.0
5.0
4.0
3.0 3.1
4.0
3.5 3.7
2010 20122011 2013 2014
4.3
0
10
20
50
40
30
30.0
33.3
30.0
36.4
2010 20122011 2013 2014
27.3
(10,000 tons) (%) (%)
Fujitsu made progress in paying down borrowings while issuing ¥80.0 billion in
straight bonds to cover the redemption of straight bonds and repayment of
short-term borrowings. The D/E ratio was 0.91 times, an increase of 0.05 of a
point compared to the end of fiscal 2012.
Capital expenditure was largely unchanged from the previous year. Capital
investments increased in the services business, mainly in connection with data
centers in and outside of Japan. However, this was offset by keeping expenditure
in the LSI business under control.
As retained earnings became negative on a non-consolidated basis, Fujitsu did
not pay an interim dividend in fiscal 2013, after refraining from paying a year-end
dividend for fiscal 2012. However, the Company decided to pay a year-end
dividend of ¥4 per share for fiscal 2013. As a result, the annual dividend for fiscal
2013 comprised only the year-end dividend of ¥4 per share.
R&D expenses increased in the Technology Solutions segment, with a primary focus
on network products. Overall R&D spending fell by 4.2%, mainly due to increased
development efficiency in mobile phones and PCs, and the effects of selling the
microcontroller and analog device businesses in the LSI device business.
Fujitsu’s total greenhouse gas emissions on a global
basis as of the end of fiscal 2014 had been cut by 29.4%
compared to fiscal 1991 year-end levels, exceeding the
20% target.
Fujitsu is promoting selective training for female
employees, among other initiatives, aiming to achieve
a 20% ratio of women both as employees and as newly
appointed managers by fiscal 2020.
Fujitsu actively appoints external directors to strengthen
its oversight function. As of the end of fiscal 2013, 3 of
the 11 directors were external directors. One external
director resigned as of the end of December 2013,
lowering the ratio of external directors compared with
the end of fiscal 2012.
INTEREST-BEARING LOANS AND DEBT/ EQUITY(D/E) RATIO
CAPITAL EXPENDITURE CASH DIVIDENDS
R&D EXPENSES
TRENDS IN TOTAL GREENHOUSE GAS
EMISSIONS (WHOLE GROUP AND GLOBAL)
RATIO OF EXTERNAL DIRECTORS
(NON-CONSOLIDATED)
TRENDS IN FEMALE MANAGERS
(NON-CONSOLIDATED)
Up
Up
Down
NON-FINANCIAL DATA (ESG INDICATORS)
(Years ended March 31) (Years ended March 31) (Years ended March 31)
Down
D/E Ratio +0.05 of a percentage point
Capital Expenditure +0.4 % Cash Dividends –¥1
R&D Expenses –4.2 %
015
FUJITSU LIMITED ANNUAL REPORT 2014
MANAGEMENT FACTS & FIGURESRESPONSIBILITYPERFORMANCE
PERFORMANCE HIGHLIGHTS