Fujitsu 2012 Annual Report Download - page 11
Download and view the complete annual report
Please find page 11 of the 2012 Fujitsu annual report below. You can navigate through the pages in the report by either clicking on the pages listed below, or by using the keyword search tool below to find specific information within the annual report.-
 1
1 -
 2
2 -
 3
3 -
 4
4 -
 5
5 -
 6
6 -
 7
7 -
 8
8 -
 9
9 -
 10
10 -
 11
11 -
 12
12 -
 13
13 -
 14
14 -
 15
15 -
 16
16 -
 17
17 -
 18
18 -
 19
19 -
 20
20 -
 21
21 -
 22
22 -
23
-
24
-
25
-
26
-
27
-
28
-
29
-
30
-
31
-
32
-
33
-
34
-
35
-
36
-
37
-
38
-
39
-
40
-
41
-
42
-
43
-
44
-
45
-
46
-
47
-
48
-
49
-
50
-
51
-
52
-
53
-
54
-
55
-
56
-
57
-
58
-
59
-
60
-
61
-
62
-
63
-
64
-
65
-
66
-
67
-
68
-
69
-
70
-
71
-
72
-
73
-
74
-
75
-
76
-
77
-
78
-
79
-
80
-
81
-
82
-
83
-
84
-
85
-
86
-
87
-
88
-
89
-
90
-
91
-
92
-
93
-
94
-
95
-
96
-
97
-
98
-
99
-
100
-
101
-
102
-
103
-
104
-
105
-
106
-
107
-
108
-
109
-
110
-
111
-
112
-
113
-
114
-
115
-
116
-
117
-
118
-
119
-
120
-
121
-
122
-
123
-
124
-
125
-
126
-
127
-
128
-
129
-
130
-
131
-
132
-
133
-
134
-
135
-
136
-
137
-
138
-
139
-
140
-
141
-
142
-
143
-
144
-
145
 |
 |

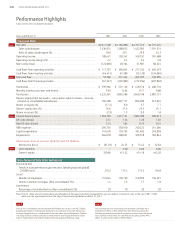
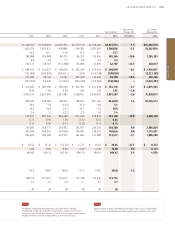
Yen (millions)
Year-on-Year
Change (%)
U.S. Dollars
(thousands)
2007 2008 2009 2010 2011 2012 2012/2011 2012
¥5,100,163 ¥5,330,865 ¥4,692,991 ¥4,679,519 ¥4,528,405 ¥4,467,574 –1.3 $54,482,610
1,825,255 1,923,621 1,499,886 1,748,304 1,587,363 1,506,096 –5.1 18,367,024
35.8 36.1 32.0 37.4 35.1 33.7
182,088 204,989 68,772 94,373 132,594 105,304 –20.6 1,284,195
3.6 3.8 1.5 2.0 2.9 2.4
102,415 48,107 (112,388) 93,085 55,092 42,707 –22.5 520,817
¥ 408,765 ¥ 322,072 ¥ 248,098 ¥ 295,389 ¥ 255,534 ¥ 240,010 –6.1 $ 2,926,951
(151,083) (283,926) (224,611) 1,020 (142,108) (190,830) — (2,327,195)
257,682 38,146 23,487 296,409 113,426 49,180 –56.6 599,756
(234,953) 62,325 (47,894) (405,310) (166,933) (138,966) — (1,694,707)
¥ 412,387 ¥ 383,106 ¥ 306,456 ¥ 322,301 ¥ 341,438 ¥ 334,116 –2.1 $ 4,074,585
0.93 1.03 0.98 1.04 1.02 1.01 –1.0
3,943,724 3,821,963 3,221,982 3,228,051 3,024,097 2,945,507 –2.6 35,920,817
969,522 948,204 748,941 798,662 821,244 841,039 2.4 10,256,573
10.9 5.0 (13.2) 12.0 6.8 5.1
24.6 24.8 23.2 24.7 27.2 28.6
2.6 1.2 (3.2) 2.9 1.8 1.4
745,817 887,336 883,480 577,443 470,823 381,148 –19.0 4,648,146
0.77 0.94 1.18 0.72 0.57 0.45
0.31 0.36 0.47 0.20 0.14 0.14
254,095 258,717 249,902 224,951 236,210 238,360 0.9 2,906,829
305,285 249,063 167,690 126,481 130,218 140,626 8.0 1,714,951
202,825 200,509 223,975 164,844 141,698 131,577 –7.1 1,604,598
¥ 49.54 ¥ 23.34 ¥ (54.35) ¥ 45.21 ¥ 26.62 ¥ 20.64 –22.5 $ 0.252
6.00 8.00 8.00 8.00 10.00 10.00 0.0 0.122
469.02 458.31 362.30 386.79 396.81 406.42 2.4 4.956
153.0 189.4 166.8 131.3 118.5 109.8 –7.3
160,977 167,374 165,612 172,438 172,336 173,155
2.2 2.4 2.9 3.1 3.5 3.7
20 20 20 30 30 36
POINT 3POINT 4
The balance of interest-bearing loans was at its lowest level in a decade.
Consequently, the D/E ratio improved 0.12 points year on year, to 0.45 times, its
lowest point ever. The net D/E ratio was 0.14 times, the same level as a year earlier,
despite a decline in cash and cash equivalents at the end of fiscal 2011.
Both the interim and year-end dividends were ¥5 per share, for an annual dividend
of ¥10 per share as initially forecast; Fujitsu paid the same dividend in fiscal 2010.
009
FUJITSU LIMITED ANNUAL REPORT 2012
Management