Food Lion 2009 Annual Report Download - page 148
Download and view the complete annual report
Please find page 148 of the 2009 Food Lion annual report below. You can navigate through the pages in the report by either clicking on the pages listed below, or by using the keyword search tool below to find specific information within the annual report.-
 1
1 -
2
-
3
-
4
-
5
-
6
-
7
-
8
-
9
-
10
-
11
-
12
-
13
-
14
-
15
-
16
-
17
-
18
-
19
-
20
-
21
-
22
-
23
-
24
-
25
-
26
-
27
-
28
-
29
-
30
-
31
-
32
-
33
-
34
-
35
-
36
-
37
-
38
-
39
-
40
-
41
-
42
-
43
-
44
-
45
-
46
-
47
-
48
-
49
-
50
-
51
-
52
-
53
-
54
-
55
-
56
-
57
-
58
-
59
-
60
-
61
-
62
-
63
-
64
-
65
-
66
-
67
-
68
-
69
-
70
-
71
-
72
-
73
-
74
-
75
-
76
-
77
-
78
-
79
-
80
-
81
-
82
-
83
-
84
-
85
-
86
-
87
-
88
-
89
-
90
-
91
-
92
-
93
-
94
-
95
-
96
-
97
-
98
-
99
-
100
-
101
-
102
-
103
-
104
-
105
-
106
-
107
-
108
-
109
-
110
-
111
-
112
-
113
-
114
-
115
-
116
-
117
-
118
-
119
-
120
-
121
-
122
-
123
-
124
-
125
-
126
-
127
-
128
-
129
-
130
-
131
-
132
-
133
-
134
-
135
-
136
-
137
-
 138
138 -
 139
139 -
 140
140 -
 141
141 -
 142
142 -
 143
143 -
 144
144 -
 145
145 -
 146
146 -
 147
147 -
 148
148 -
 149
149 -
 150
150 -
 151
151 -
 152
152 -
 153
153 -
 154
154 -
 155
155 -
 156
156 -
 157
157 -
 158
158 -
159
-
160
-
161
-
162
-
163
 |
 |

144 - Delhaize Group - Annual Report 2009
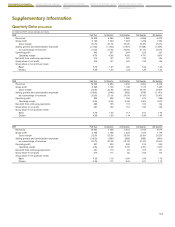
CONSOLIDATED STATEMENT
OF CHANGES IN EQUITY
CONSOLIDATED STATEMENT
OF CASH FLOWS
NOTES TO THE FINANCIAL
STATEMENTS
CONSOLIDATED STATEMENT
OF COMPREHENSIVE INCOME
CONSOLIDATED INCOME
STATEMENT
CONSOLIDATED BALANCE SHEET
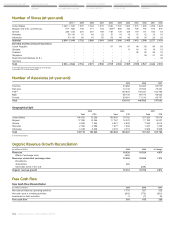
Number of Stores (at year-end)
2010
(1)
2009 2008 2007 2006 2005 2004 2003 2002 2001 2000
United States 1 640 - 1 645 1 607 1 594 1 570 1 549 1 537 1 523 1 515 1 485 1 459 1 420
Belgium and G.D. Luxembourg 817 - 822 792 771 734 840(2) 806 745 726 707 675 615
Greece 229 - 234 216 201 159 148 135 129 119 111 104 53
Romania 59 - 64 51 40 22 18 16 16 15 12 10 10
Indonesia 83 - 88 66 63 56 50 46 42 38 34 29 20
Subtotal 2 834 - 2 844 2 732 2 669 2 541 2 605 2 540 2 455 2 413 2 349 2 277 2 118
Divested and Discontinued Operations
Czech Republic - - - - 97 94 97 94 93 94 99
Slovakia - - - - - - 11 14 16 16 15
Thailand - - - - - - - 36 34 26 18
Singapore - - - - - - - - 35 31 30
Super Discount Markets (U.S.) - - - - - - - - - - 30
Germany - - 4 4 3 2 2 2 - - -
Total 2 834 - 2 844 2 732 2 673 2 545 2 705 2 636 2 565 2 559 2 527 2 444 2 310
(1) Estimates based on planned openings and closings.
(2) Includes 132 Di stores sold in 2007.
Number of Associates (at year-end)
2009 2008 2007
Full-time 63 980 64 400 62 570
Part-time 74 139 76 592 75 261
FTE(1) 103 833 106 247 103 786
Male 68 138 69 774 68 044
Female 69 981 71 218 69 787
Total 138 119 140 992 137 831
Geographical Split
2009 2008 2007
Total FTE
(1)
Total FTE Total FTE
United States 104 655 75 298 108 808 78 782 107 920 78 076
Belgium 17 058 14 264 17 167 14 370 17 190 14 527
Greece 9 586 7 544 8 821 6 930 7 545 6 016
Romania 2 382 2 289 1 877 1 846 1 247 1 238
Indonesia 4 438 4 438 4 319 4 319 3 929 3 929
Total 138 119 103 833 140 992 106 247 137 831 103 786
(1) Full-time equivalent.
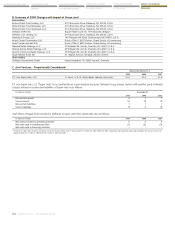
Organic Revenue Growth Reconciliation
(in millions of EUR) 2009 2008 % Change
Revenues 19 938 19 024 4.8%
Effect of exchange rates (680) -
Revenues at identical exchange rates 19 258 19 024 1.2%
Divestitures - -
Acquisitions (46) -
53rd sales week in the U.S. - (258)
Organic revenue growth 19 212 18 766 2.4%
Free Cash Flow
Free Cash Flow Reconciliation
(in millions of EUR) 2009 2008 2007
Net cash provided by operating activities 1 176 927 932
Net cash used in investing activities (663) (770) (630)
Investment in debt securities 5 (7) 24
Free cash flow 518 150 326