Emerson 2009 Annual Report Download - page 17
Download and view the complete annual report
Please find page 17 of the 2009 Emerson annual report below. You can navigate through the pages in the report by either clicking on the pages listed below, or by using the keyword search tool below to find specific information within the annual report.-
 1
1 -
2
-
3
-
4
-
5
-
6
-
 7
7 -
 8
8 -
 9
9 -
 10
10 -
 11
11 -
 12
12 -
 13
13 -
 14
14 -
 15
15 -
 16
16 -
 17
17 -
 18
18 -
 19
19 -
 20
20 -
 21
21 -
 22
22 -
 23
23 -
 24
24 -
 25
25 -
 26
26 -
 27
27 -
28
-
29
-
30
-
31
-
32
-
33
-
34
-
35
-
36
-
37
-
38
-
39
-
40
-
41
-
42
-
43
-
44
-
45
-
46
-
47
-
48
-
49
-
50
-
51
-
52
-
53
-
54
-
55
-
56
 |
 |

Annual Report 15
There were no discontinued operations in scal 2009. The
$42 million loss from discontinued operations ($0.05 per
share) in scal 2008 included the $42 million gain on the
divestiture of Brooks, the $92 million loss related to the
divestiture of the European appliance motor and pump
business, and $8 million of combined earnings related to
these divestitures. Fiscal 2007 income from discontinued
operations related to the European appliance motor and
pump business was $7 million, or $0.01 per share. See
previous discussion under Acquisitions and Divestitures
and Note 3 for additional information regarding prior year
discontinued operations.
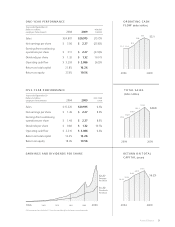
Net earnings were $1.7 billion and earnings per share
were $2.27 for 2009, decreases of 29 percent and
26 percent, respectively, compared with 2008, due to
the same factors discussed previously. Net earnings as
a percent of net sales were 8.2 percent and 9.7 percent
in 2009 and 2008. Return on stockholders’ equity (net
earnings divided by average stockholders’ equity) was
19.5 percent in 2009 compared with 27.0 percent in
2008. Return on total capital was 16.2 percent in 2009
compared with 21.8 percent in 2008, and is computed
as net earnings excluding after-tax net interest expense,
divided by average stockholders’ equity plus short- and
long-term debt less cash and short-term investments.
Net earnings were $2.4 billion and earnings per share
were $3.06 for 2008, increases of 13 percent and
15 percent, respectively, compared with net earnings
and earnings per share of $2.1 billion and $2.66,
respectively, in 2007. Net earnings as a percent of net
sales were 9.7 percent in 2008 and 2007. Net earnings
in 2008 included the net loss from discontinued opera-
tions discussed previously. Return on stockholders’
equity reached 27.0 percent in 2008 compared with
25.2 percent in 2007, and the Company realized a 2008
return on total capital of 21.8 percent compared with
20.1 percent in 2007.
Following is a summary of segment results for scal 2009
compared with scal 2008, and also 2008 compared with
scal 2007. The Company denes segment earnings as
earnings before interest and taxes.
n Process Management n Climate Technologies
n Industrial Automation n Appliance and Tools
n Network Power
C h A n G e c h a n g e
(d o l l A R s in m i l l i o n s ) 2007 2008 2009 ‘07-‘08 ‘08 - ‘09
Sales $5,699 6,652 17%
Earnings $1,066 1,306 23%
Margin 18.7% 19.6%
Process Management segment sales
were $6.2 billion in 2009, a decrease of $419 million, or
6 percent, from 2008. Nearly all of the Process businesses
reported lower sales and earnings, particularly for the
measurement and ow business resulting primarily from
weakness in the chemical, rening and marine markets.
Sales were down slightly for the valves business while
the power and water business had a small sales increase.
The segment sales decrease reects a 2 percent decline
in underlying sales on lower volume, a 6 percent
($373 million) unfavorable impact from foreign currency
translation and a 2 percent ($94 million) favorable impact
primarily from the Roxar acquisition. Regionally, sales
declined 6 percent in the United States while interna-
tional sales were at, as growth in Asia (7 percent) offset
decreases in Europe (4 percent), Middle East/Africa
(3 percent), Canada (6 percent) and Latin America
(2 percent). Earnings decreased 18 percent to
$1,068 million from $1,306 million in the prior year,
reecting the lower sales volume, negative product mix,
higher rationalization costs of $43 million and a
$12 million negative impact from foreign currency
transactions related to the strengthening of the U.S. dollar
in 2009 versus weakening in the prior year, partially
offset by savings from cost reduction actions. The
margin decrease primarily reects unfavorable product
mix (approximately 2 points) and deleverage on lower
volume, which were partially offset by productivity
13%
21%
45%
21%
14%
29%
15%
17%
25%