Emerson 2009 Annual Report Download - page 13
Download and view the complete annual report
Please find page 13 of the 2009 Emerson annual report below. You can navigate through the pages in the report by either clicking on the pages listed below, or by using the keyword search tool below to find specific information within the annual report.-
 1
1 -
2
-
 3
3 -
 4
4 -
 5
5 -
 6
6 -
 7
7 -
 8
8 -
 9
9 -
 10
10 -
 11
11 -
 12
12 -
 13
13 -
 14
14 -
 15
15 -
 16
16 -
 17
17 -
 18
18 -
 19
19 -
 20
20 -
 21
21 -
 22
22 -
 23
23 -
24
-
25
-
26
-
27
-
28
-
29
-
30
-
31
-
32
-
33
-
34
-
35
-
36
-
37
-
38
-
39
-
40
-
41
-
42
-
43
-
44
-
45
-
46
-
47
-
48
-
49
-
50
-
51
-
52
-
53
-
54
-
55
-
56
 |
 |

Annual Report 11
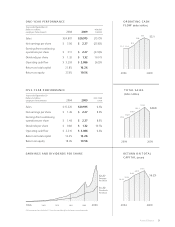
Years ended September 30 | Dollars in millions, except per share amounts
C h A n G e c h a n g e
2007 2008 2009 2007-2008 2008 - 2009
Net sales $22,131 24,807 12%
Gross profit $ 8,065 9,139 13%
Percent of sales 36.4% 36.8% 36.8%
SG&A $ 4,569 5,057
Percent of sales 20.6% 20.3% 21.7%
Other deductions, net $ 175 303
Interest expense, net $ 228 188
Earnings from continuing operations
before income taxes $ 3,093 3,591 16%
Percent of sales 14.0% 14.5% 11.6%
Earnings from continuing operations $ 2,129 2,454 15%
Net earnings $ 2,136 2,412 13%
Percent of sales 9.7% 9.7% 8.2%
Diluted EPS – Earnings from continuing operations $ 2.65 3.11 17%
Diluted EPS – Net earnings $ 2.66 3.06 15%
Return on equity 25.2% 27.0%
Return on total capital 20.1% 21.8%
Fiscal 2009 was a very challenging year as a signicant
decline in gross xed investment worldwide, particu-
larly for capital goods and nonresidential construction,
as well as housing and consumer spending, adversely
impacted sales and earnings for all of the Company’s
business segments. These declines began in the third
quarter of scal 2008, continued throughout 2009, and
the Company anticipates continued weakness stem-
ming from these factors for much of scal 2010. Given
the difcult economic environment, the Company took
aggressive actions and incurred signicant costs to
rationalize its businesses to the level appropriate for the
conditions and to improve its cost structure in prepara-
tion for the ultimate recovery. Fiscal 2009 net sales were
$20.9 billion, a decrease of 16 percent; earnings from
continuing operations and earnings from continuing
operations per share were $1.7 billion and $2.27,
decreases of 30 percent and 27 percent, respectively;
net earnings and net earnings per share were $1.7 billion
and $2.27, decreases of 29 percent and 26 percent,
respectively, from scal 2008. Underlying sales declined
across all major geographic regions, particularly in the
United States and Europe. Sales in Asia were down slightly
but included a 2 percent increase in China. Unfavorable
foreign currency translation also negatively impacted
results for the year due to the strength of the U.S. dollar
as compared with 2008. Sales and earnings for scal 2009
decreased versus prior year in all segments, reecting
lower spending and investment by both businesses and
consumers as condence declined and remained low.
Although operating in a challenging environment, the
Company was able to achieve gross margin consistent
with prior year due to the benets of rationalization
actions and other productivity improvements, as well
as higher pricing in certain markets and materials cost
containment. Earnings margins decreased primarily
because of deleverage on lower sales volume and higher
rationalization expense. Despite the economic environ-
ment, Emerson’s nancial position remains strong and in
2009 the Company generated cash near the same level as
the prior year with operating cash ow of $3.1 billion and
free cash ow (operating cash ow less capital expendi-
tures) of $2.6 billion. Emerson maintains a conservative
nancial structure to provide the strength and exibility
necessary to achieve its strategic objectives.
Net sales for scal 2009 were $20.9 billion, a decrease
of approximately $3.9 billion, or 16 percent, from scal
2008. Sales declined across all segments as the Compa-
ny’s businesses continued to be impacted by the broad
slowdown in consumer and capital goods businesses.
Consolidated results reect an approximate 13 percent
($3,090 million) decrease in underlying sales (which