Emerson 2009 Annual Report Download - page 11
Download and view the complete annual report
Please find page 11 of the 2009 Emerson annual report below. You can navigate through the pages in the report by either clicking on the pages listed below, or by using the keyword search tool below to find specific information within the annual report.-
 1
1 -
 2
2 -
 3
3 -
 4
4 -
 5
5 -
 6
6 -
 7
7 -
 8
8 -
 9
9 -
 10
10 -
 11
11 -
 12
12 -
 13
13 -
 14
14 -
 15
15 -
 16
16 -
 17
17 -
 18
18 -
 19
19 -
 20
20 -
 21
21 -
 22
22 -
23
-
24
-
25
-
26
-
27
-
28
-
29
-
30
-
31
-
32
-
33
-
34
-
35
-
36
-
37
-
38
-
39
-
40
-
41
-
42
-
43
-
44
-
45
-
46
-
47
-
48
-
49
-
50
-
51
-
52
-
53
-
54
-
55
-
56
 |
 |

Annual Report 9
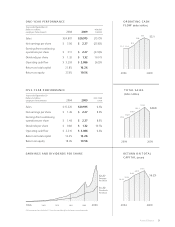
ONE-YEAR PERFORMANCE
Years ended September 30
Dollars in millions, p e R C e n t
except per share amounts2008 2009 C h A n G e
Sales $24,807 (15.7)%
Net earnings per share $ 3.06 (25.8)%
Earnings from continuing
operations per share $ 3.11 (2 7.0) %
Dividends per share $ 1.20 10.0 %
Operating cash ow $ 3,293 (6.3)%
Return on total capital 21.8%
Return on equity 27.0%
FIVE-YEAR PERFORMANCE
Years ended September 30
Dollars in millions, f i v e -y e A R
except per share amounts2004 2009 C A G R
Sales $15,226 6.6%
Net earnings per share $ 1.49 8.8%
Earnings from continuing
operations per share $ 1.48 8.9%
Dividends per share $ 0.80 10.5%
Operating cash ow $ 2,216 6.8%
Return on total capital 14.2%
Return on equity 18.4%
TOTAL SALES
(dollars in billions)
2004
2009
$16.9
$19.7
$22.1
$24.8
$15.2
R E T U R N O N T O T A L
CAPITAL (percent)
2009
2004
15.5%
18.4%
20.1%
21.8%
14.2%
OPERATING CASH
FLOW (dollars in billions)
2004
2009
$2.2
$2.5
$3.0
$3.3
$2.2
$2.27
Earnings
Per Share
1956 1969 1979 1989 1999 2009
2002 earnings per share is before the $1.12 per share cumulative effect of a change in accounting principle.
$1.32
Dividends
Per Share
EARNINGS AND DIVIDENDS PER SHARE