Electronic Arts 2008 Annual Report Download - page 180
Download and view the complete annual report
Please find page 180 of the 2008 Electronic Arts annual report below. You can navigate through the pages in the report by either clicking on the pages listed below, or by using the keyword search tool below to find specific information within the annual report.-
 1
1 -
2
-
3
-
4
-
5
-
6
-
7
-
8
-
9
-
10
-
11
-
12
-
13
-
14
-
15
-
16
-
17
-
18
-
19
-
20
-
21
-
22
-
23
-
24
-
25
-
26
-
27
-
28
-
29
-
30
-
31
-
32
-
33
-
34
-
35
-
36
-
37
-
38
-
39
-
40
-
41
-
42
-
43
-
44
-
45
-
46
-
47
-
48
-
49
-
50
-
51
-
52
-
53
-
54
-
55
-
56
-
57
-
58
-
59
-
60
-
61
-
62
-
63
-
64
-
65
-
66
-
67
-
68
-
69
-
70
-
71
-
72
-
73
-
74
-
75
-
76
-
77
-
78
-
79
-
80
-
81
-
82
-
83
-
84
-
85
-
86
-
87
-
88
-
89
-
90
-
91
-
92
-
93
-
94
-
95
-
96
-
97
-
98
-
99
-
100
-
101
-
102
-
103
-
104
-
105
-
106
-
107
-
108
-
109
-
110
-
111
-
112
-
113
-
114
-
115
-
116
-
117
-
118
-
119
-
120
-
121
-
122
-
123
-
124
-
125
-
126
-
127
-
128
-
129
-
130
-
131
-
132
-
133
-
134
-
135
-
136
-
137
-
138
-
139
-
140
-
141
-
142
-
143
-
144
-
145
-
146
-
147
-
148
-
149
-
150
-
151
-
152
-
153
-
154
-
155
-
156
-
157
-
158
-
159
-
160
-
161
-
162
-
163
-
164
-
165
-
166
-
167
-
168
-
169
-
 170
170 -
 171
171 -
 172
172 -
 173
173 -
 174
174 -
 175
175 -
 176
176 -
 177
177 -
 178
178 -
 179
179 -
 180
180 -
 181
181 -
 182
182 -
 183
183 -
 184
184 -
 185
185 -
 186
186 -
 187
187 -
 188
188 -
 189
189 -
 190
190 -
191
-
192
-
193
-
194
-
195
-
196
 |
 |

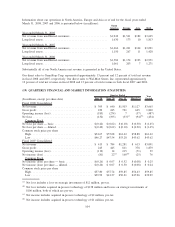
Information about our operations in North America, Europe and Asia as of and for the fiscal years ended
March 31, 2008, 2007 and 2006 is presented below (in millions): North
America Europe Asia Total
Year ended March 31, 2008
Net revenue from unaffiliated customers ........................ $1,942 $1,541 $182 $3,665
Long-lived assets ......................................... 1,630 173 10 1,813
Year ended March 31, 2007
Net revenue from unaffiliated customers ........................ $1,666 $1,261 $164 $3,091
Long-lived assets ......................................... 1,150 267 11 1,428
Year ended March 31, 2006
Net revenue from unaffiliated customers ........................ $1,584 $1,174 $193 $2,951
Long-lived assets ......................................... 1,061 203 7 1,271
Substantially all of our North America net revenue is generated in the United States.
Our direct sales to GameStop Corp. represented approximately 13 percent and 12 percent of total net revenue
in fiscal 2008 and 2007, respectively. Our direct sales to Wal-Mart Stores, Inc. represented approximately
12 percent of total net revenue in fiscal 2008 and 13 percent of total revenue in both fiscal 2007 and 2006.
(19) QUARTERLY FINANCIAL AND MARKET INFORMATION (UNAUDITED)
(In millions, except per share data) June 30 Sept. 30 Dec. 31 March 31
Year
Ended
Quarter Ended
Fiscal 2008 Consolidated
Net revenue ................................... $ 395 $ 640 $1,503 $1,127 $3,665
Gross profit ................................... 229 245 721 665 1,860
Operating income (loss) .......................... (183) (274) 7 (37) (487)
Netloss...................................... (132) (195) (33)
(a)
(94)
(b)
(454)
Common Stock
Net loss per share — basic ........................ $(0.42) $(0.62) $(0.10) $(0.30) $(1.45)
Net loss per share — diluted ....................... $(0.42) $(0.62) $(0.10) $(0.30) $(1.45)
Common stock price per share
High....................................... $54.67 $57.08 $61.62 $58.88 $61.62
Low....................................... $46.27 $47.54 $53.28 $43.62 $43.62
Fiscal 2007 Consolidated
Net revenue ................................... $ 413 $ 784 $1,281 $ 613 $3,091
Gross profit ................................... 245 445 811 378 1,879
Operating income (loss) .......................... (119) 14 215 (71) 39
Net income (loss) ............................... (81) 22
(c)
160
(d)
(25) 76
Common Stock
Net income (loss) per share — basic ................. $(0.26) $ 0.07 $ 0.52 $(0.08) $ 0.25
Net income (loss) per share — diluted ................ $(0.26) $ 0.07 $ 0.50 $(0.08) $ 0.24
Common stock price per share
High....................................... $57.80 $57.74 $59.85 $54.43 $59.85
Low....................................... $39.99 $41.37 $50.21 $47.96 $39.99
(a)
Net loss includes a loss on strategic investment of $12 million, pre-tax.
(b)
Net loss includes acquired in-process technology of $138 million and losses on strategic investments of
$106 million, both of which are pre-tax.
(c)
Net income includes acquired in-process technology of $2 million, pre-tax.
(d)
Net income includes acquired in-process technology of $1 million, pre-tax.
104