Electronic Arts 2008 Annual Report Download - page 126
Download and view the complete annual report
Please find page 126 of the 2008 Electronic Arts annual report below. You can navigate through the pages in the report by either clicking on the pages listed below, or by using the keyword search tool below to find specific information within the annual report.-
 1
1 -
2
-
3
-
4
-
5
-
6
-
7
-
8
-
9
-
10
-
11
-
12
-
13
-
14
-
15
-
16
-
17
-
18
-
19
-
20
-
21
-
22
-
23
-
24
-
25
-
26
-
27
-
28
-
29
-
30
-
31
-
32
-
33
-
34
-
35
-
36
-
37
-
38
-
39
-
40
-
41
-
42
-
43
-
44
-
45
-
46
-
47
-
48
-
49
-
50
-
51
-
52
-
53
-
54
-
55
-
56
-
57
-
58
-
59
-
60
-
61
-
62
-
63
-
64
-
65
-
66
-
67
-
68
-
69
-
70
-
71
-
72
-
73
-
74
-
75
-
76
-
77
-
78
-
79
-
80
-
81
-
82
-
83
-
84
-
85
-
86
-
87
-
88
-
89
-
90
-
91
-
92
-
93
-
94
-
95
-
96
-
97
-
98
-
99
-
100
-
101
-
102
-
103
-
104
-
105
-
106
-
107
-
108
-
109
-
110
-
111
-
112
-
113
-
114
-
115
-
 116
116 -
 117
117 -
 118
118 -
 119
119 -
 120
120 -
 121
121 -
 122
122 -
 123
123 -
 124
124 -
 125
125 -
 126
126 -
 127
127 -
 128
128 -
 129
129 -
 130
130 -
 131
131 -
 132
132 -
 133
133 -
 134
134 -
 135
135 -
 136
136 -
137
-
138
-
139
-
140
-
141
-
142
-
143
-
144
-
145
-
146
-
147
-
148
-
149
-
150
-
151
-
152
-
153
-
154
-
155
-
156
-
157
-
158
-
159
-
160
-
161
-
162
-
163
-
164
-
165
-
166
-
167
-
168
-
169
-
170
-
171
-
172
-
173
-
174
-
175
-
176
-
177
-
178
-
179
-
180
-
181
-
182
-
183
-
184
-
185
-
186
-
187
-
188
-
189
-
190
-
191
-
192
-
193
-
194
-
195
-
196
 |
 |
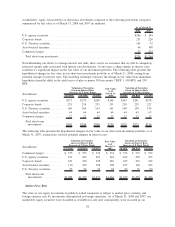
Changes in Cash Flow
During fiscal 2008, we generated $338 million of cash from operating activities as compared to $397 million
for fiscal 2007. The decrease in cash provided by operating activities for fiscal 2008 as compared to fiscal
2007 was primarily due to (1) an increase in operating expenses paid resulting from an increase in advertising
and marketing costs, external development expenses and personnel-related expenses and (2) a $90 million
increase in incentive-based cash compensation paid in fiscal 2008 which were earned with respect to fiscal
2007 performance. These decreases were significantly offset by higher net revenue collected during fiscal
2008 as compared to fiscal 2007.
For fiscal 2008, we generated $2,306 million of cash proceeds from maturities and sales of short-term
investments and $192 million in proceeds from sales of common stock through our stock-based compensation
plans. Our primary use of cash in non-operating activities consisted of (1) $1,739 million used to purchase
short-term investments, (2) $607 million for the acquisition of VGH, and (3) $277 million used to purchase
marketable equitable securities and other investments.
Short-term investments and marketable equity securities
Due to our mix of fixed and variable rate securities, our short-term investment portfolio is susceptible to
changes in short-term interest rates. As of March 31, 2008, our short-term investments had gross unrealized
gains of $9 million, or 1 percent of the total in short-term investments, and gross unrealized losses of less than
$1 million, or less than 1 percent of the total in short-term investments. From time to time, we may liquidate
some or all of our short-term investments to fund operational needs or other activities, such as capital
expenditures, business acquisitions or stock repurchase programs. Depending on which short-term investments
we liquidate to fund these activities, we could recognize a portion, or all, of the gross unrealized gains or
losses.
Marketable equity securities increased to $729 million as of March 31, 2008, from $341 million as of
March 31, 2007, primarily due to (1) an increase of $251 million in the fair value of our investment in Ubisoft
Entertainment, (2) our $167 million investment in The9, and (3) our $83 million common stock investment in
Neowiz. These increases were partially offset by (1) an $81 million impairment recognized on The9
investment and (2) a $28 million impairment recognized on the Neowiz common stock investment. In addition
to the Neowiz common stock investment noted above, we made a $27 million preferred stock investment in
Neowiz which is classified in other assets on our Consolidated Balance Sheet. We recognized a $9 million
impairment on our Neowiz preferred stock investment.
Receivables, net
Our gross accounts receivable balances were $544 million and $470 million as of March 31, 2008 and 2007,
respectively. The increase in our accounts receivable balance was primarily due to higher sales volumes during
the fourth quarter of fiscal 2008 as compared to the fourth quarter of fiscal 2007. Reserves for sales returns,
pricing allowances and doubtful accounts increased in absolute dollars from $214 million as of March 31,
2007 to $238 million as of March 31, 2008. As a percentage of trailing nine month net revenue, reserves
decreased from 8 percent as of March 31, 2007, to 7 percent as of March 31, 2008. We believe these reserves
are adequate based on historical experience and our current estimate of potential returns, pricing allowances
and doubtful accounts.
Inventories
Inventories increased to $168 million as of March 31, 2008 from $62 million as of March 31, 2007, primarily
as a result of (1) $64 million in Rock Band inventory, of which approximately $43 million was in-transit as of
March 31, 2008, and (2) the overall growth of our business.
50