Electronic Arts 2008 Annual Report Download - page 179
Download and view the complete annual report
Please find page 179 of the 2008 Electronic Arts annual report below. You can navigate through the pages in the report by either clicking on the pages listed below, or by using the keyword search tool below to find specific information within the annual report.-
 1
1 -
2
-
3
-
4
-
5
-
6
-
7
-
8
-
9
-
10
-
11
-
12
-
13
-
14
-
15
-
16
-
17
-
18
-
19
-
20
-
21
-
22
-
23
-
24
-
25
-
26
-
27
-
28
-
29
-
30
-
31
-
32
-
33
-
34
-
35
-
36
-
37
-
38
-
39
-
40
-
41
-
42
-
43
-
44
-
45
-
46
-
47
-
48
-
49
-
50
-
51
-
52
-
53
-
54
-
55
-
56
-
57
-
58
-
59
-
60
-
61
-
62
-
63
-
64
-
65
-
66
-
67
-
68
-
69
-
70
-
71
-
72
-
73
-
74
-
75
-
76
-
77
-
78
-
79
-
80
-
81
-
82
-
83
-
84
-
85
-
86
-
87
-
88
-
89
-
90
-
91
-
92
-
93
-
94
-
95
-
96
-
97
-
98
-
99
-
100
-
101
-
102
-
103
-
104
-
105
-
106
-
107
-
108
-
109
-
110
-
111
-
112
-
113
-
114
-
115
-
116
-
117
-
118
-
119
-
120
-
121
-
122
-
123
-
124
-
125
-
126
-
127
-
128
-
129
-
130
-
131
-
132
-
133
-
134
-
135
-
136
-
137
-
138
-
139
-
140
-
141
-
142
-
143
-
144
-
145
-
146
-
147
-
148
-
149
-
150
-
151
-
152
-
153
-
154
-
155
-
156
-
157
-
158
-
159
-
160
-
161
-
162
-
163
-
164
-
165
-
166
-
167
-
168
-
 169
169 -
 170
170 -
 171
171 -
 172
172 -
 173
173 -
 174
174 -
 175
175 -
 176
176 -
 177
177 -
 178
178 -
 179
179 -
 180
180 -
 181
181 -
 182
182 -
 183
183 -
 184
184 -
 185
185 -
 186
186 -
 187
187 -
 188
188 -
 189
189 -
190
-
191
-
192
-
193
-
194
-
195
-
196
 |
 |

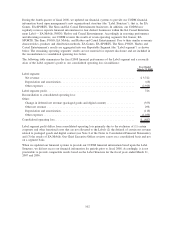
The following table summarizes the financial performance of our previous Publishing structure segments and a
reconciliation of the Publishing segment’s profit to our consolidated operating income (in millions):
2007 2006
Year Ended March 31,
Publishing segment:
Net revenue ........................................................ $2,948 $2,927
Depreciation and amortization ........................................... (22) (19)
Other expenses ...................................................... (1,685) (1,690)
Publishing segment profit ................................................ 1,241 1,218
Reconciliation to consolidated operating income:
Other:
Change in deferred net revenue (packaged goods and digital content) .............. — —
Other net revenue .................................................... 143 24
Depreciation and amortization ........................................... (145) (76)
Other expenses ...................................................... (1,200) (841)
Consolidated operating income ............................................ $ 39 $ 325
Publishing segment profit differs from consolidated operating income primarily due to the exclusion of
(1) substantially all of our research and development expense, as well as certain corporate functional costs that
are not allocated to the publishing organizations, and (2) the deferral of certain net revenue related to packaged
goods and digital content.
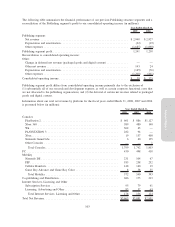
Information about our total net revenue by platform for the fiscal years ended March 31, 2008, 2007 and 2006
is presented below (in millions):
2008 2007 2006
Year Ended March 31,
Consoles
PlayStation 2 ................................................. $ 601 $ 886 $1,127
Xbox 360 ................................................... 589 480 140
Wii........................................................ 302 65 —
PLAYSTATION 3 ............................................. 282 94 —
Xbox ....................................................... 19 157 400
Nintendo GameCube ........................................... 6 60 135
Other Consoles ............................................... — — 1
Total Consoles .............................................. 1,799 1,742 1,803
PC .......................................................... 430 498 418
Mobility
Nintendo DS ................................................. 231 104 67
PSP........................................................ 185 258 252
Cellular Handsets .............................................. 148 140 19
Game Boy Advance and Game Boy Color ........................... 8 38 55
Total Mobility .............................................. 572 540 393
Co-publishing and Distribution...................................... 686 175 213
Internet Services, Licensing and Other
Subscription Services ........................................... 95 79 61
Licensing, Advertising and Other .................................. 83 57 63
Total Internet Services, Licensing and Other ........................ 178 136 124
Total Net Revenue ............................................... $3,665 $3,091 $2,951
Annual Report
103