Dish Network 2008 Annual Report Download - page 65
Download and view the complete annual report
Please find page 65 of the 2008 Dish Network annual report below. You can navigate through the pages in the report by either clicking on the pages listed below, or by using the keyword search tool below to find specific information within the annual report.-
 1
1 -
2
-
3
-
4
-
5
-
6
-
7
-
8
-
9
-
10
-
11
-
12
-
13
-
14
-
15
-
16
-
17
-
18
-
19
-
20
-
21
-
22
-
23
-
24
-
25
-
26
-
27
-
28
-
29
-
30
-
31
-
32
-
33
-
34
-
35
-
36
-
37
-
38
-
39
-
40
-
41
-
42
-
43
-
44
-
45
-
46
-
47
-
48
-
49
-
50
-
51
-
52
-
53
-
54
-
 55
55 -
 56
56 -
 57
57 -
 58
58 -
 59
59 -
 60
60 -
 61
61 -
 62
62 -
 63
63 -
 64
64 -
 65
65 -
 66
66 -
 67
67 -
 68
68 -
 69
69 -
 70
70 -
 71
71 -
 72
72 -
 73
73 -
 74
74 -
 75
75 -
76
-
77
-
78
-
79
-
80
-
81
-
82
-
83
-
84
-
85
-
86
-
87
-
88
-
89
-
90
-
91
-
92
-
93
-
94
-
95
-
96
-
97
-
98
-
99
-
100
-
101
-
102
-
103
-
104
-
105
-
106
-
107
-
108
-
109
-
110
-
111
-
112
-
113
-
114
-
115
-
116
-
117
-
118
-
119
-
120
-
121
-
122
-
123
-
124
-
125
-
126
-
127
-
128
-
129
-
130
-
131
-
132
-
133
-
134
-
135
-
136
-
137
-
138
-
139
-
140
-
141
-
142
-
143
-
144
 |
 |
Item 7. MANAGEMENT’S DISCUSSION AND ANALYSIS OF FINANCIAL CONDITION AND
RESULTS OF OPERATIONS - Continued
55
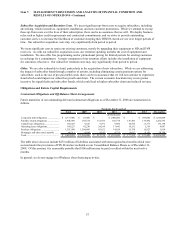
unrealized losses (gains) on investments.” The decrease in cash resulting from changes in operating assets and
liabilities primarily relates to increases in cash outflows of $619 million resulting from changes in accounts payable,
accounts receivable, income tax receivable, deferred revenue and inventories, partially offset by a $277 million increase
in net amounts payable to EchoStar. The decrease in “Purchases of property and equipment” in 2008 was primarily
attributable to a decline in expenditures for satellite construction, corporate capital expenditures, and equipment under
our lease program for new subscribers, partially offset by increased spending for equipment under our lease program
for existing subscribers.
The improvement in free cash flow from 2006 to 2007 of $289 million resulted from an increase in “Net cash flows
from operating activities” of $337 million, or 14.8%, partially offset by an increase in “Purchases of property and
equipment” of $48 million, or 3.5%. The increase in “Net cash flows from operating activities” was primarily
attributable to a $602 million increase in net income, including changes in: (i) “Depreciation and amortization”
expense, (ii) “Deferred tax expense (benefit),” and (iii) “Realized and unrealized losses (gains) on investments.” This
increase was partially offset by a $272 million decrease in cash resulting from changes in operating assets and
liabilities. The 2007 increase in “Purchases of property and equipment” was primarily attributable to an increase in
capital expenditures for satellite construction, and equipment under our lease program for existing subscribers, partially
offset by decreased spending for equipment under our lease program for new subscribers.
Cash flows from operating activities. We typically reinvest the cash flow from operating activities in our business
primarily to grow our subscriber base and to expand our infrastructure. For the years ended December 31, 2008,
2007 and 2006, we reported net cash flows from operating activities of $2.188 billion, $2.617 billion, and $2.279
billion, respectively. See discussion of changes in net cash flows from operating activities included in “Free cash
flow” above.
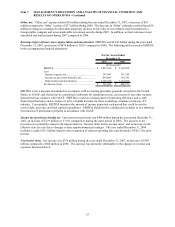
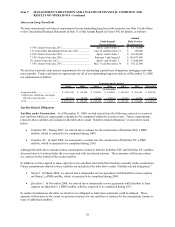
Cash flows from investing activities. Our investing activities generally include purchases and sales of marketable
investment securities, strategic investments and cash used to grow our subscriber base and expand our infrastructure.
For the years ended December 31, 2008, 2007 and 2006, we reported net cash outflows from investing activities of
$1.597 billion, $2.471 billion and $2.149 billion, respectively. During the years ended December 31, 2008, 2007 and
2006, capital expenditures for new and existing customer equipment totaled $920 million, $928 million and $985
million, respectively.
The decrease in net cash outflows from investing activities from 2007 to 2008 of $874 million primarily resulted from a
net decrease in purchases of marketable investment securities, a decrease in cash used for purchases of property and
equipment, a decrease in cash used for the purchases of strategic investments, including Sling Media, and an increase in
proceeds from the sale of investments. The overall net decreases were partially offset by an increase in cash used for
purchases of FCC authorizations during 2008 compared to 2007.
The increase in net cash outflows from investing activities from 2006 to 2007 of $322 million primarily resulted from
an increase in cash used for the purchases of strategic investments, including Sling Media, FCC licenses and capital
expenditures, partially offset by a decrease in net purchases of marketable investment securities during 2007.
Cash flows from financing activities. Our financing activities generally include net proceeds related to the issuance of
long-term debt, cash used for the repurchase or redemption of long-term debt, payment of capital lease obligations,
mortgages or other notes payable, and repurchases of our Class A common stock. For the years ended December 31,
2008 and 2007, we reported net cash outflows from financing activities of $1.412 billion and $976 million,
respectively. For the year ended December 31, 2006, we reported net cash inflows from financing activities of $1.022
billion.
The increase in net cash outflows from 2007 to 2008 includes an increase in cash outflows for debt redemptions,
distributions related to the Spin-off and stock repurchases, partially offset by an increase in cash inflows related to
issuance of new debt during 2008.
The increase in cash outflows from 2006 to 2007 primarily resulted from the issuance of $2 billion of new debt during
2006.