Dish Network 2008 Annual Report Download - page 141
Download and view the complete annual report
Please find page 141 of the 2008 Dish Network annual report below. You can navigate through the pages in the report by either clicking on the pages listed below, or by using the keyword search tool below to find specific information within the annual report.-
 1
1 -
2
-
3
-
4
-
5
-
6
-
7
-
8
-
9
-
10
-
11
-
12
-
13
-
14
-
15
-
16
-
17
-
18
-
19
-
20
-
21
-
22
-
23
-
24
-
25
-
26
-
27
-
28
-
29
-
30
-
31
-
32
-
33
-
34
-
35
-
36
-
37
-
38
-
39
-
40
-
41
-
42
-
43
-
44
-
45
-
46
-
47
-
48
-
49
-
50
-
51
-
52
-
53
-
54
-
55
-
56
-
57
-
58
-
59
-
60
-
61
-
62
-
63
-
64
-
65
-
66
-
67
-
68
-
69
-
70
-
71
-
72
-
73
-
74
-
75
-
76
-
77
-
78
-
79
-
80
-
81
-
82
-
83
-
84
-
85
-
86
-
87
-
88
-
89
-
90
-
91
-
92
-
93
-
94
-
95
-
96
-
97
-
98
-
99
-
100
-
101
-
102
-
103
-
104
-
105
-
106
-
107
-
108
-
109
-
110
-
111
-
112
-
113
-
114
-
115
-
116
-
117
-
118
-
119
-
120
-
121
-
122
-
123
-
124
-
125
-
126
-
127
-
128
-
129
-
130
-
 131
131 -
 132
132 -
 133
133 -
 134
134 -
 135
135 -
 136
136 -
 137
137 -
 138
138 -
 139
139 -
 140
140 -
 141
141 -
 142
142 -
 143
143 -
 144
144
 |
 |
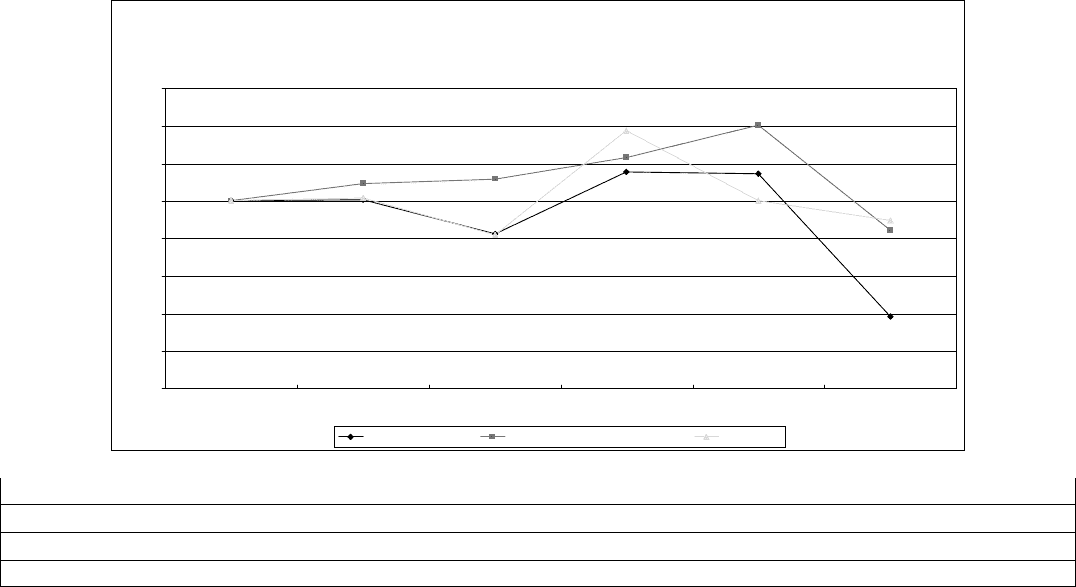
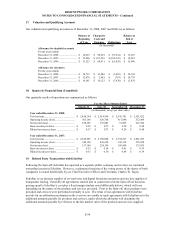
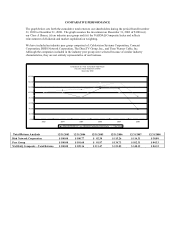
COMPARATIVE PERFORMANCE
The graph below sets forth the cumulative total return to our shareholders during the period from December
31, 2003 to December 31, 2008. The graph assumes the investment on December 31, 2003 of $100 in (i)
our Class A Shares, (ii) an industry peer group and (iii) the NASDAQ Composite Index and reflects
reinvestment of dividends and market capitalization weighting.
We have included an industry peer group comprised of: Cablevision Systems Corporation, Comcast
Corporation, DISH Network Corporation, The DirecTV Group, Inc., and Time Warner Cable, Inc.
Although the companies included in the industry peer group were selected because of similar industry
characteristics, they are not entirely representative of our business.
Comparison of 5 Year Cumulative Total Return
Assumes Initial Investment of $100
December 2008
0.00
20.00
40.00
60.00
80.00
100.00
120.00
140.00
160.00
2003 2004 2005 2006 2007 2008
DISH NETWORK CP NASDAQ Composite-Total Returns Peer Group
Total Return Analysis 12/31/2003 12/31/2004 12/31/2005 12/31/2006 12/31/2007 12/31/2008
Dish Network Corporation $ 100.00 $ 100.77 $ 82.38 $ 115.26 $ 114.31 $ 38.09
Peer Group $ 100.00 $ 101.60 $ 81.97 $ 134.73 $ 102.31 $ 84.33
NASDAQ Composite – Total Returns $ 100.00 $ 109.16 $ 111.47 $ 123.05 $ 140.12 $ 84.12