Dish Network 2008 Annual Report Download - page 100
Download and view the complete annual report
Please find page 100 of the 2008 Dish Network annual report below. You can navigate through the pages in the report by either clicking on the pages listed below, or by using the keyword search tool below to find specific information within the annual report.-
 1
1 -
2
-
3
-
4
-
5
-
6
-
7
-
8
-
9
-
10
-
11
-
12
-
13
-
14
-
15
-
16
-
17
-
18
-
19
-
20
-
21
-
22
-
23
-
24
-
25
-
26
-
27
-
28
-
29
-
30
-
31
-
32
-
33
-
34
-
35
-
36
-
37
-
38
-
39
-
40
-
41
-
42
-
43
-
44
-
45
-
46
-
47
-
48
-
49
-
50
-
51
-
52
-
53
-
54
-
55
-
56
-
57
-
58
-
59
-
60
-
61
-
62
-
63
-
64
-
65
-
66
-
67
-
68
-
69
-
70
-
71
-
72
-
73
-
74
-
75
-
76
-
77
-
78
-
79
-
80
-
81
-
82
-
83
-
84
-
85
-
86
-
87
-
88
-
89
-
 90
90 -
 91
91 -
 92
92 -
 93
93 -
 94
94 -
 95
95 -
 96
96 -
 97
97 -
 98
98 -
 99
99 -
 100
100 -
 101
101 -
 102
102 -
 103
103 -
 104
104 -
 105
105 -
 106
106 -
 107
107 -
 108
108 -
 109
109 -
 110
110 -
111
-
112
-
113
-
114
-
115
-
116
-
117
-
118
-
119
-
120
-
121
-
122
-
123
-
124
-
125
-
126
-
127
-
128
-
129
-
130
-
131
-
132
-
133
-
134
-
135
-
136
-
137
-
138
-
139
-
140
-
141
-
142
-
143
-
144
 |
 |

DISH NETWORK CORPORATION
NOTES TO CONSOLIDATED FINANCIAL STATEMENTS - Continued
F-18
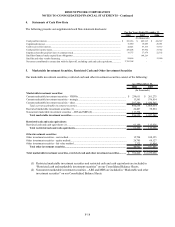
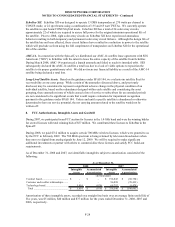
4. Statements of Cash Flow Data
The following presents our supplemental cash flow statement disclosure:
2008 2007 2006
Cash paid for interest.............................................................................................................................
$ 385,936 $ 405,915 $ 418,587
Capitalized interest................................................................................................................................
16,880 18,088 20,091
Cash received for interest......................................................................................................................
44,843 97,575 73,337
Cash paid for income taxes....................................................................................................................
430,408 87,994 37,742
Employee benefits paid in Class A common stock................................................................................
19,375 17,674 22,102
Satellites financed under capital lease obligations.................................................................................
- 198,219 -
Satellite and other vendor financing .....................................................................................................
24,469 - 15,000
Net assets contributed in connection with the Spin-off, excluding cash and cash equivalents...............
2,765,398 - -
For the Years Ended December 31,
(In thousands)
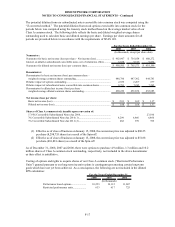
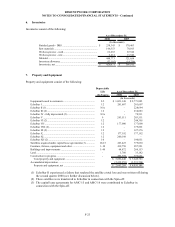
5. Marketable Investment Securities, Restricted Cash and Other Investment Securities
Our marketable investment securities, restricted cash and other investment securities consist of the following:
As of December 31,
2008 2007
(In thousands)
Marketable investment securities:
Current marketable investment securities - VRDNs ........................................................................... 239,611$ 261,275$
Current marketable investment securities - strategic........................................................................... 13,561 576,814
Current marketable investment securities - other ................................................................................ 207,386 1,030,565
Total current marketable investment securities.............................................................................460,558 1,868,654
Restricted marketable investment securities (1).................................................................................. 22,407 58,894
Noncurrent marketable investment securities - ARS and MBS (2)..................................................... 113,394 -
Total marketable investment securities...................................................................................... 596,359 1,927,548
Restricted cash and cash equivalents:
Restricted cash and cash equivalents (1)............................................................................................. 61,199 113,626
Total restricted cash and cash equivalents.................................................................................61,199 113,626
Other investment securities:
Other investment securities - cost method........................................................................................... 15,794 108,355
Other investment securities - equity method........................................................................................ 26,785 68,127
Other investment securities - fair value method................................................................................... 2,323 11,404
Total other investment securities................................................................................................ 44,902 187,886
Total marketable investment securities, restricted cash and other investment securities........... 702,460$ 2,229,060$
(1) Restricted marketable investment securities and restricted cash and cash equivalents are included in
“Restricted cash and marketable investment securities” on our Consolidated Balance Sheets.
(2) Noncurrent marketable investment securities – ARS and MBS are included in “Marketable and other
investment securities” on our Consolidated Balance Sheets.