Dish Network 2008 Annual Report Download - page 61
Download and view the complete annual report
Please find page 61 of the 2008 Dish Network annual report below. You can navigate through the pages in the report by either clicking on the pages listed below, or by using the keyword search tool below to find specific information within the annual report.-
 1
1 -
2
-
3
-
4
-
5
-
6
-
7
-
8
-
9
-
10
-
11
-
12
-
13
-
14
-
15
-
16
-
17
-
18
-
19
-
20
-
21
-
22
-
23
-
24
-
25
-
26
-
27
-
28
-
29
-
30
-
31
-
32
-
33
-
34
-
35
-
36
-
37
-
38
-
39
-
40
-
41
-
42
-
43
-
44
-
45
-
46
-
47
-
48
-
49
-
50
-
 51
51 -
 52
52 -
 53
53 -
 54
54 -
 55
55 -
 56
56 -
 57
57 -
 58
58 -
 59
59 -
 60
60 -
 61
61 -
 62
62 -
 63
63 -
 64
64 -
 65
65 -
 66
66 -
 67
67 -
 68
68 -
 69
69 -
 70
70 -
 71
71 -
72
-
73
-
74
-
75
-
76
-
77
-
78
-
79
-
80
-
81
-
82
-
83
-
84
-
85
-
86
-
87
-
88
-
89
-
90
-
91
-
92
-
93
-
94
-
95
-
96
-
97
-
98
-
99
-
100
-
101
-
102
-
103
-
104
-
105
-
106
-
107
-
108
-
109
-
110
-
111
-
112
-
113
-
114
-
115
-
116
-
117
-
118
-
119
-
120
-
121
-
122
-
123
-
124
-
125
-
126
-
127
-
128
-
129
-
130
-
131
-
132
-
133
-
134
-
135
-
136
-
137
-
138
-
139
-
140
-
141
-
142
-
143
-
144
 |
 |
Item 7. MANAGEMENT’S DISCUSSION AND ANALYSIS OF FINANCIAL CONDITION AND
RESULTS OF OPERATIONS - Continued
51
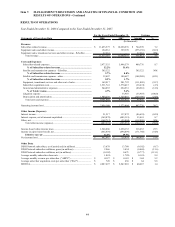
DISH Network subscribers. As of December 31, 2007, we had approximately 13.780 million DISH Network
subscribers compared to approximately 13.105 million subscribers at December 31, 2006, an increase of 5.2%. DISH
Network added approximately 3.434 million gross new subscribers for the year ended December 31, 2007, compared to
approximately 3.516 million gross new subscribers during 2006, a decrease of approximately 82,000 gross new
subscribers.
DISH Network added approximately 675,000 net new subscribers for the year ended December 31, 2007, compared to
approximately 1.065 million net new subscribers during 2006, a decrease of 36.6%. This decrease primarily resulted
from an increase in our subscriber churn rate, churn on a larger subscriber base, and the decrease in gross new
subscribers discussed above.
Subscriber-related revenue. DISH Network “Subscriber-related revenue” totaled $10.691 billion for the year ended
December 31, 2007, an increase of $1.269 billion or 13.5% compared to 2006. This increase was directly
attributable to continued DISH Network subscriber growth and the increase in “ARPU” discussed below.
ARPU. Monthly average revenue per subscriber was $65.83 during the year ended December 31, 2007 versus $62.78
during the same period in 2006. The $3.05 or 4.9% increase in ARPU is primarily attributable to price increases in
February 2007 and 2006 on some of our most popular programming packages, increased penetration of HD
programming, higher equipment rental fees resulting from increased penetration of our equipment leasing programs,
other hardware related fees, fees for DVRs, and revenue from increased availability of standard definition and HD
local channels by satellite.
Equipment sales and other revenue. “Equipment sales and other revenue” totaled $399 million during the year ended
December 31, 2007, an increase of $3 million or 0.8% compared to 2006. During 2007, we experienced a slight
increase in sales of non-DISH Network digital receivers and related components to international customers, offset by a
decrease in domestic sales of DBS accessories.
Subscriber-related expenses. “Subscriber-related expenses” totaled $5.497 billion during the year ended December
31, 2007, an increase of $689 million or 14.3% compared to 2006. The increase in “Subscriber-related expenses” was
primarily attributable to the increase in the number of DISH Network subscribers and the items discussed below that
contributed to the increase in the expense to revenue ratio. “Subscriber-related expenses” as a percentage of
“Subscriber-related revenue” increased to 51.4% from 51.0% in the year ended December 31, 2007 compared to
2006. The increase in this expense to revenue ratio primarily resulted from increases in: (i) programming costs, (ii)
in-home service, refurbishment and repair costs for our receiver systems associated with increased penetration of our
equipment lease programs, and (iii) bad debt expense resulting from an increase in the number of subscribers who
we deactivated for non-payment of their bill. These increases were partially offset by a decline in costs associated
with our call center operations and in costs associated with our previous co-branding arrangement with AT&T.
Satellite and transmission expenses - other. “Satellite and transmission expenses - other” totaled $181 million during
the year ended December 31, 2007, an increase of $33 million or 22.5% compared to 2006. This increase primarily
resulted from higher operational costs associated with our capital lease of Anik F3 which commenced commercial
operations in April 2007 and the higher costs associated with our enhanced content platform including a broader
distribution of more extensive HD programming. “Satellite and transmission expenses - other” as a percentage of
“Subscriber-related revenue” increased to 1.7% from 1.6% in the year ended December 31, 2007 compared to 2006.