Costco 2006 Annual Report Download - page 62
Download and view the complete annual report
Please find page 62 of the 2006 Costco annual report below. You can navigate through the pages in the report by either clicking on the pages listed below, or by using the keyword search tool below to find specific information within the annual report.-
 1
1 -
2
-
3
-
4
-
5
-
6
-
7
-
8
-
9
-
10
-
11
-
12
-
13
-
14
-
15
-
16
-
17
-
18
-
19
-
20
-
21
-
22
-
23
-
24
-
25
-
26
-
27
-
28
-
29
-
30
-
31
-
32
-
33
-
34
-
35
-
36
-
37
-
38
-
39
-
40
-
41
-
42
-
43
-
44
-
45
-
46
-
47
-
48
-
49
-
50
-
51
-
 52
52 -
 53
53 -
 54
54 -
 55
55 -
 56
56 -
 57
57 -
 58
58 -
 59
59 -
 60
60 -
 61
61 -
 62
62 -
 63
63 -
 64
64 -
 65
65 -
 66
66 -
 67
67 -
 68
68 -
 69
69 -
 70
70 -
 71
71 -
 72
72 -
73
-
74
-
75
-
76
 |
 |

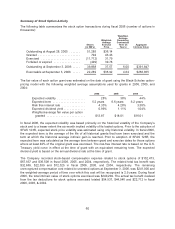
Summary of Stock Option Activity
The following table summarizes the stock option transactions during fiscal 2006 (number of options in
thousands):
Shares
(in 000’s)
Weighted-
Average
Exercise
Price
Weighted-
Average
Remaining
Contractual
Term (in
Years) Aggregate
Intrinsic Value
Outstanding at August 28, 2005 ....... 51,285 $36.14
Granted ........................... 794 46.46
Exercised ......................... (11,712) 31.79
Forfeited or expired ................. (499) 39.78
Outstanding at September 3, 2006 ..... 39,868 37.57 6.00 $391,847
Exercisable at September 3, 2006 ..... 22,289 $35.92 4.64 $256,655
The fair value of each option grant was estimated on the date of grant using the Black-Scholes option-
pricing model with the following weighted average assumptions used for grants in 2006, 2005, and
2004:
2006 2005 2004
Expected volatility .................. 28% 38% 44%
Expected term ..................... 5.2years 6.6 years 6.2 years
Risk free interest rate ............... 4.33% 4.28% 3.38%
Expected dividend yield .............. 0.99% 1.11% 1.04%
Weighted-average fair value per option
granted ......................... $13.87 $18.01 $16.01
In fiscal 2006, the expected volatility was based primarily on the historical volatility of the Company’s
stock and to a lesser extent the six-month implied volatility of its traded options. Prior to the adoption of
SFAS 123R, expected stock price volatility was estimated using only historical volatility. In fiscal 2006,
the expected term is the average of the life of all historical grants that have been exercised and the
term at which the historical average intrinsic gain is reached. Prior to adoption of SFAS 123R, the
expected term was calculated as the average term between grant and exercise dates for those options
where at least 40% of the original grant was exercised. The risk-free interest rate is based on the U.S.
Treasury yield curve in effect at the time of grant with an equivalent remaining term. The expected
dividend yield is based on the annual dividend rate at the time of grant.
The Company recorded stock-based compensation expense related to stock options of $102,473,
$67,937 and $36,508 in fiscal 2006, 2005, and 2004, respectively. The related total tax benefit was
$32,665, $22,539 and $12,325 in fiscal 2006, 2005, and 2004, respectively. The remaining
unrecognized compensation cost related to unvested options at September 3, 2006, was $241,000 and
the weighted-average period of time over which this cost will be recognized is 2.9 years. During fiscal
2006, the total intrinsic value of stock options exercised was $240,200. The actual tax benefit realized
from the tax deductions for stock options exercised totaled $54,937, $44,946 and $22,712 in fiscal
2006, 2005, & 2004.
60