Costco 2006 Annual Report Download - page 29
Download and view the complete annual report
Please find page 29 of the 2006 Costco annual report below. You can navigate through the pages in the report by either clicking on the pages listed below, or by using the keyword search tool below to find specific information within the annual report.-
 1
1 -
2
-
3
-
4
-
5
-
6
-
7
-
8
-
9
-
10
-
11
-
12
-
13
-
14
-
15
-
16
-
17
-
18
-
 19
19 -
 20
20 -
 21
21 -
 22
22 -
 23
23 -
 24
24 -
 25
25 -
 26
26 -
 27
27 -
 28
28 -
 29
29 -
 30
30 -
 31
31 -
 32
32 -
 33
33 -
 34
34 -
 35
35 -
 36
36 -
 37
37 -
 38
38 -
 39
39 -
40
-
41
-
42
-
43
-
44
-
45
-
46
-
47
-
48
-
49
-
50
-
51
-
52
-
53
-
54
-
55
-
56
-
57
-
58
-
59
-
60
-
61
-
62
-
63
-
64
-
65
-
66
-
67
-
68
-
69
-
70
-
71
-
72
-
73
-
74
-
75
-
76
 |
 |

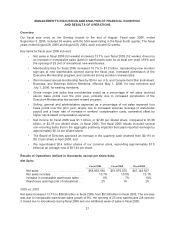
Net Income
Fiscal 2006 Fiscal 2005 Fiscal 2004
Net income .............................. $1,103,215 $1,063,092 $882,393
Net income increase ....................... 3.8% 20.5% 22.4%
Net income as a percentage of net sales ...... 1.87% 2.05% 1.87%
Diluted earnings per share .................. $ 2.30 $ 2.18 $ 1.85
Shares used to calculate diluted earnings per
share ................................. 480,341 492,035 482,459
Diluted earnings per share increase .......... 6% 18% 21%
2006 vs. 2005
Net income for fiscal 2006 increased 3.8%, to $1.10 billion or $2.30 per diluted share, from $1.06 billion or
$2.18 per diluted share, during fiscal 2005. The fiscal 2005 results included several non-recurring items
that in the aggregate positively impacted reported earnings for all of fiscal 2005 by approximately $0.14
per share: a $54.2 million (approximately $0.11 per diluted share) income tax benefit resulting primarily
from the settlement of a transfer pricing dispute between the United States and Canada; a cumulative
pre-tax, non-cash charge to preopening expenses of $16.0 million (approximately $0.02 per diluted share)
related to a correction to our method of accounting for ground leases; and a net tax benefit with respect to
excess foreign tax credits on unremitted foreign earnings recorded in the fourth quarter of $20.6 million
(approximately $0.04 per diluted share). Exclusive of these items, fiscal 2005 earnings were $2.04 per
diluted share. Fiscal 2006’s earnings per diluted share represents an increase of 13% over that figure.
2005 vs. 2004 Net Income
Net income for fiscal 2005 increased 20.5% to $1.06 billion, or $2.18 per diluted share, from $882.4
million, or $1.85 per diluted share, during fiscal year 2004. As discussed above, the fiscal 2005 results
included several non-recurring items that in the aggregate positively impacted reported earnings for all of
fiscal 2005 by approximately $0.14 per share. Exclusive of these items, fiscal 2005 earnings were $2.04
per diluted share, which represents an increase of 10% over fiscal 2004 earnings per diluted share.
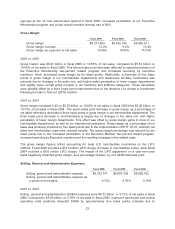
Liquidity and Capital Resources (dollars in thousands, except per share amounts)
The following table itemizes components of our most liquid assets:
September 3,
2006 August 28, 2005
Cash and cash equivalents ........................... $1,510,939 $2,062,585
Short-term investments .............................. 1,322,181 1,397,272
Total .......................................... $2,833,120 $3,459,857
Our primary sources of liquidity are cash flows generated from warehouse operations and our existing
cash and cash equivalents and short-term investments balances, which were $2.83 billion and $3.46
billion at September 3, 2006 and August 28, 2005, respectively. Of these balances, approximately
$594 million and $522 million at September 3, 2006 and August 28, 2005, respectively, represented
debit and credit card receivables, primarily related to weekend sales immediately prior to the year-end
close. The decrease in our most liquid assets of $627 million to $2.83 billion at September 3, 2006 was
due primarily to the repurchase of our common stock, the acquisition of property and equipment related
to warehouse expansion and the payment of cash dividends.
27