Costco 2006 Annual Report Download - page 44
Download and view the complete annual report
Please find page 44 of the 2006 Costco annual report below. You can navigate through the pages in the report by either clicking on the pages listed below, or by using the keyword search tool below to find specific information within the annual report.-
 1
1 -
2
-
3
-
4
-
5
-
6
-
7
-
8
-
9
-
10
-
11
-
12
-
13
-
14
-
15
-
16
-
17
-
18
-
19
-
20
-
21
-
22
-
23
-
24
-
25
-
26
-
27
-
28
-
29
-
30
-
31
-
32
-
33
-
 34
34 -
 35
35 -
 36
36 -
 37
37 -
 38
38 -
 39
39 -
 40
40 -
 41
41 -
 42
42 -
 43
43 -
 44
44 -
 45
45 -
 46
46 -
 47
47 -
 48
48 -
 49
49 -
 50
50 -
 51
51 -
 52
52 -
 53
53 -
 54
54 -
55
-
56
-
57
-
58
-
59
-
60
-
61
-
62
-
63
-
64
-
65
-
66
-
67
-
68
-
69
-
70
-
71
-
72
-
73
-
74
-
75
-
76
 |
 |

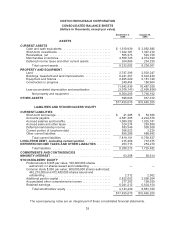
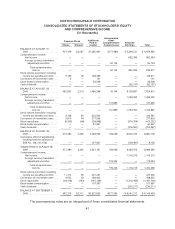
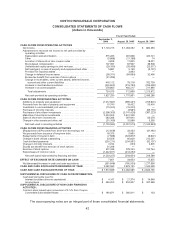
COSTCO WHOLESALE CORPORATION
CONSOLIDATED STATEMENTS OF CASH FLOWS
(dollars in thousands)
Fiscal Year Ended
September 3,
2006 August 28, 2005 August 29, 2004
CASH FLOWS FROM OPERATING ACTIVITIES
Net income ................................................ $1,103,215 $ 1,063,092 $ 882,393
Adjustments to reconcile net income to net cash provided by
operating activities:
Depreciation and amortization .............................. 515,285 481,838 440,721
Other .................................................. (5,888) (11,186) 74
Accretion of discount on zero coupon notes ................... 4,828 11,855 18,421
Stock-based compensation ................................ 107,397 67,937 36,508
Undistributed equity earnings in joint ventures ................. (28,180) (26,459) (23,517)
Net loss/(gain) on sale of property and equipment and other ..... 5,867 5,139 (9,122)
Provision for impaired assets ............................... — 3,893 —
Change in deferred income taxes ........................... (38,311) (64,690) 32,496
Excess tax benefit from exercise of stock options .............. (31,296) — —
Change in receivables, other current assets, deferred income,
accrued and other current liabilities ........................ 416,112 78,118 762,739
Increase in merchandise inventories ......................... (500,602) (315,793) (256,438)
Increase in accounts payable ............................... 278,863 482,217 211,990
Total adjustments ...................................... 724,075 712,869 1,213,872
Net cash provided by operating activities ..................... 1,827,290 1,775,961 2,096,265
CASH FLOWS FROM INVESTING ACTIVITIES
Additions to property and equipment ........................... (1,212,567) (995,431) (705,620)
Proceeds from the sale of property and equipment ............... 15,740 19,432 55,400
Investment in unconsolidated joint venture ...................... (15,000) (15,000) —
Purchase of minority interests ................................ — (3,961) (95,153)
Purchases of short-term investments .......................... (2,598,355) (3,741,429) (387,223)
Maturities of short-term investments ........................... 2,424,503 2,401,248 —
Sales of short-term investments .............................. 263,288 267,640 83,278
Change in other assets and other, net ......................... (31,169) 15,988 3,355
Net cash used in investing activities ......................... (1,153,560) (2,051,513) (1,045,963)
CASH FLOWS FROM FINANCING ACTIVITIES
(Repayments of)/Proceeds from short-term borrowings, net ....... (12,929) 33,433 (31,492)
Net proceeds from issuance of long-term debt ................... 18,375 5,660 —
Repayments of long-term debt ................................ (7,586) (303,877) (6,602)
Change in bank checks outstanding ........................... 33,559 85,829 212,251
Cash dividend payments .................................... (230,211) (204,567) (92,137)
Change in minority interests .................................. 4,744 (130) 2,805
Excess tax benefit from exercise of stock options ................ 31,296 — —
Exercise of stock options .................................... 372,336 278,253 124,744
Repurchases of common stock ............................... (1,442,811) (413,252) —
Net cash (used in)/provided by financing activities ............. (1,233,227) (518,651) 209,569
EFFECT OF EXCHANGE RATE CHANGES ON CASH ............ 7,851 33,653 17,825
Net (decrease)/increase in cash and cash equivalents ............ (551,646) (760,550) 1,277,696
CASH AND CASH EQUIVALENTS BEGINNING OF YEAR ......... 2,062,585 2,823,135 1,545,439
CASH AND CASH EQUIVALENTS END OF YEAR ............... $1,510,939 $ 2,062,585 $ 2,823,135
SUPPLEMENTAL DISCLOSURE OF CASH FLOW INFORMATION:
Cash paid during the year for:
Interest (excludes amounts capitalized) ...................... $ 4,147 $ 21,374 $ 14,648
Income taxes ............................................ $ 546,205 $ 804,957 $ 327,368
SUPPLEMENTAL DISCLOSURE OF NON-CASH FINANCING
ACTIVITIES:
Common stock issued upon conversion of 3
1
⁄
2
% Zero Coupon
Convertible Subordinated Notes ............................ $ 190,871 $ 280,811 $ 133
The accompanying notes are an integral part of these consolidated financial statements.
42