Citrix 2009 Annual Report Download - page 2
Download and view the complete annual report
Please find page 2 of the 2009 Citrix annual report below. You can navigate through the pages in the report by either clicking on the pages listed below, or by using the keyword search tool below to find specific information within the annual report.-
 1
1 -
 2
2 -
 3
3 -
 4
4 -
 5
5 -
 6
6 -
 7
7 -
 8
8 -
 9
9 -
 10
10 -
 11
11 -
 12
12 -
 13
13 -
14
-
15
-
16
-
17
-
18
-
19
-
20
-
21
-
22
-
23
-
24
-
25
-
26
-
27
-
28
-
29
-
30
-
31
-
32
-
33
-
34
-
35
-
36
-
37
-
38
-
39
-
40
-
41
-
42
-
43
-
44
-
45
-
46
-
47
-
48
-
49
-
50
-
51
-
52
-
53
-
54
-
55
-
56
-
57
-
58
-
59
-
60
-
61
-
62
-
63
-
64
-
65
-
66
-
67
-
68
-
69
-
70
-
71
-
72
-
73
-
74
-
75
-
76
-
77
-
78
-
79
-
80
-
81
-
82
-
83
-
84
-
85
-
86
-
87
-
88
-
89
-
90
-
91
-
92
-
93
-
94
-
95
-
96
-
97
-
98
-
99
-
100
-
101
-
102
-
103
-
104
-
105
-
106
-
107
-
108
-
109
-
110
-
111
-
112
-
113
-
114
-
115
-
116
-
117
-
118
-
119
-
120
-
121
-
122
-
123
-
124
-
125
-
126
-
127
-
128
-
129
-
130
-
131
-
132
-
133
-
134
-
135
-
136
-
137
-
138
 |
 |

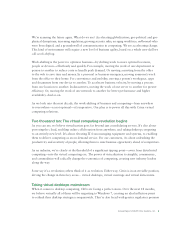
Revenue
(millions)
2007 2008 2009
Earnings Per Share
2007 2008 2009
$1.03
(In thousands, except per share data) 2009 2008 2007 2006
Net revenues
Cost of revenues:
Cost of product license revenues
Cost of services revenues
Amortization of product related intangible assets
Total cost of revenues
Gross margin
Operating expenses
Research and development
Sales, marketing and services
General and administrative
Restructuring
Amortization of other intangible assets
In-process research and development
Total operating expenses
Income from operations
Other income, net
Income before income taxes
Income taxes
Net income
Earnings per share - diluted
Weighted average shares outstanding - diluted
$1.14
$0.96
Operating Cash Flow
(millions)
2007 2008 2009
$422
$462
$484
$ 1,614,088
52,160
87,233
47,917
187,310
1,426,778
281,980
679,053
239,623
26,473
20,972
-
1,248,101
178,677
15,215
193,892
2,875
$ 191,017
$ 1.03
184,985
Year ended December 31,
$ 1,391,942
42,984
65,027
29,596
137,607
1,254,335
205,103
590,409
229,229
-
17,387
9,800
1,051,928
202,407
48,501
250,908
36,425
$ 214,483
$ 1.14
187,380
$1,614
$1,392
$1,583
$ 1,583,354
47,801
79,303
48,028
175,132
1,408,222
288,109
669,569
256,679
-
22,724
1,140
1,238,221
170,001
26,922
196,923
18,647
$ 178,276
$ 0.96
186,682
$1,134,319
32,911
46,585
19,202
98,698
1,035,621
155,331
480,343
178,669
-
16,934
1,000
832,277
203,344
39,737
243,081
60,084
$ 182,997
$ 0.97
187,725
Financial Highlights