BT 2013 Annual Report Download - page 8
Download and view the complete annual report
Please find page 8 of the 2013 BT annual report below. You can navigate through the pages in the report by either clicking on the pages listed below, or by using the keyword search tool below to find specific information within the annual report.-
 1
1 -
 2
2 -
 3
3 -
 4
4 -
 5
5 -
 6
6 -
 7
7 -
 8
8 -
 9
9 -
 10
10 -
 11
11 -
 12
12 -
 13
13 -
 14
14 -
 15
15 -
 16
16 -
 17
17 -
 18
18 -
 19
19 -
20
-
21
-
22
-
23
-
24
-
25
-
26
-
27
-
28
-
29
-
30
-
31
-
32
-
33
-
34
-
35
-
36
-
37
-
38
-
39
-
40
-
41
-
42
-
43
-
44
-
45
-
46
-
47
-
48
-
49
-
50
-
51
-
52
-
53
-
54
-
55
-
56
-
57
-
58
-
59
-
60
-
61
-
62
-
63
-
64
-
65
-
66
-
67
-
68
-
69
-
70
-
71
-
72
-
73
-
74
-
75
-
76
-
77
-
78
-
79
-
80
-
81
-
82
-
83
-
84
-
85
-
86
-
87
-
88
-
89
-
90
-
91
-
92
-
93
-
94
-
95
-
96
-
97
-
98
-
99
-
100
-
101
-
102
-
103
-
104
-
105
-
106
-
107
-
108
-
109
-
110
-
111
-
112
-
113
-
114
-
115
-
116
-
117
-
118
-
119
-
120
-
121
-
122
-
123
-
124
-
125
-
126
-
127
-
128
-
129
-
130
-
131
-
132
-
133
-
134
-
135
-
136
-
137
-
138
-
139
-
140
-
141
-
142
-
143
-
144
-
145
-
146
-
147
-
148
-
149
-
150
-
151
-
152
-
153
-
154
-
155
-
156
-
157
-
158
-
159
-
160
-
161
-
162
-
163
-
164
-
165
-
166
-
167
-
168
-
169
-
170
-
171
-
172
-
173
-
174
-
175
-
176
-
177
-
178
-
179
-
180
-
181
-
182
-
183
-
184
-
185
-
186
-
187
-
188
-
189
-
190
-
191
-
192
-
193
-
194
-
195
-
196
-
197
-
198
-
199
-
200
 |
 |

Overview
6
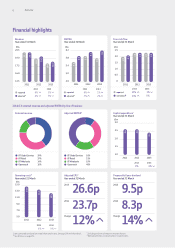
Financial highlights
2012/13 external revenue and adjusted EBITDA by line of business
Revenue
Year ended 31 March
20122011 2013
14.5
16.0
17.5
19.0
20.5
18.9
20.1
19.3
20.1
18.3
18.0
£bn
Operating costsd
Year ended 31 March
Free cash flow
Year ended 31 March
20122011 2013
0
0.5
1.0
1.5
2.0
2.5
£bn
8.3p
9.5p
14%
2013
2012
Change
Proposed full year dividend
Year ended 31 March
23.7p
26.6p
12%
2012
Change
Adjusted EPSa
Year ended 31 March
EBITDA
Year ended 31 March
4.6
5.0
5.4
5.8
6.2
£bn
20122011 2013
Capital expenditurec
Year ended 31 March
External revenue
BT Global Services 39%
BT Retail 37%
BT Wholesale 14%
Openreach 10%
Adjusted EBITDAa
BT Global Services 10%
BT Retail 31%
BT Wholesale 19%
Openreach 40%
2013
a Items presented as adjusted are stated before specific items. See page 170 for further details.
b See definition on page 171.
c Excluding purchases of telecommunications licences.
d Before depreciation and amortisation and specific items.
20122011 2013
1.0
1.5
2.0
2.5
3.0
2.6
2.6
2.4
£bn
20122011 2013
5.0
7.0
9.0
11.0
15.0
13.0
14.6
13.6
12.5
£bn
reported 6%
6%
5%
9%
5%
adjusteda4%
2013
2013
2012
2012
5.9
2.3
5.6
2.0
6.1
2.3
5.9
2.1
6.2
2.3
5.8
2.3
1%
reported 6%
2%
adjusteda3%
2013
2012
1%
reported 15%
0%
normalisedb11%
20132012
6%0%
20132012