Anthem Blue Cross 2006 Annual Report Download - page 31
Download and view the complete annual report
Please find page 31 of the 2006 Anthem Blue Cross annual report below. You can navigate through the pages in the report by either clicking on the pages listed below, or by using the keyword search tool below to find specific information within the annual report.-
 1
1 -
2
-
3
-
4
-
5
-
6
-
7
-
8
-
9
-
10
-
11
-
12
-
13
-
14
-
15
-
16
-
17
-
18
-
19
-
20
-
 21
21 -
 22
22 -
 23
23 -
 24
24 -
 25
25 -
 26
26 -
 27
27 -
 28
28 -
 29
29 -
 30
30 -
 31
31 -
 32
32 -
 33
33 -
 34
34 -
 35
35 -
 36
36
 |
 |

28-29
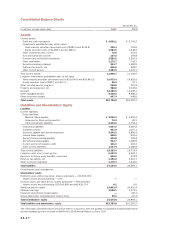
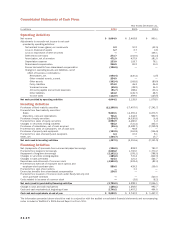
Consolidated Statements of Cash Flows
Year ended December 31,
In millions 2006 2005 2004
Operating Activities
Net income $ 3,094.9 $ 2,463.8 $ 960.1
Adjustments to reconcile net income to net cash
provided by operating activities:
Net realized losses (gains) on investments 0.3 10.2 (42.5)
Loss on disposal of assets 1.7 2.7 0.8
Loss on repurchase of debt securities — — 146.1
Deferred income taxes 273.7 (102.6) (103.4)
Amortization, net of accretion 471.9 437.9 191.0
Depreciation expense 133.0 118.7 78.1
Share-based compensation 246.9 81.2 10.0
Excess tax benefits from share-based compensation (136.5) — —
Changes in operating assets and liabilities, net of
effect of business combinations:
Receivables, net (649.4) (230.4) (2.5)
Other invested assets, current 234.9 — —
Other assets (362.4) (165.6) (89.9)
Policy liabilities 874.2 46.3 26.8
Unearned income (69.5) (38.2) 34.0
Accounts payable and accrued expenses (91.7) 188.6 (33.1)
Other liabilities 134.2 (136.7) 28.5
Income taxes (112.0) 459.6 (125.5)
Net cash provided by operating activities 4,044.2 3,135.5 1,078.5
Investing Activities
Purchases of fixed maturity securities (11,198.0) (17,457.0) (7,242.7)
Proceeds from fixed maturity securities:
Sales 9,630.1 14,391.4 6,273.5
Maturities, calls and redemptions 721.6 1,344.5 952.5
Purchase of equity securities (2,434.5) (4,530.6) (6.6)
Proceeds from sales of equity securities 2,950.9 4,480.0 1.3
Changes in securities lending collateral 485.2 (731.4) 242.0
Purchases of subsidiaries, net of cash acquired (25.4) (2,589.7) (2,239.9)
Proceeds from sales of subsidiaries, net of cash sold — 92.8 —
Purchases of property and equipment (193.9) (161.8) (136.8)
Proceeds from sale of property and equipment 6.4 10.2 9.1
Other, net (399.7) — 15.7
Net cash used in investing activities (457.3) (5,151.6) (2,131.9)
Financing Activities
Net (repayments of) proceeds from commercial paper borrowings (306.0) 808.2 793.2
Proceeds from long-term borrowings 2,668.2 1,700.0 1,770.2
Repayment of long-term borrowings (2,162.1) (155.1) (798.5)
Changes in securities lending payable (485.2) 731.4 (242.0)
Changes in bank overdrafts 414.3 121.2 224.7
Repurchase and retirement of common stock (4,550.2) (333.4) (82.3)
Proceeds from exercise of employee stock options and
employee stock purchase plan 559.5 429.3 159.0
Proceeds from sale of put options — 1.1 —
Excess tax benefits from share-based compensation 136.5 — —
Proceeds from issuance of common stock under Equity Security Unit
stock purchase contracts — — 230.0
Costs related to issuance of common stock — (3.6) (8.2)
Net cash (used in) provided by financing activities (3,725.0) 3,299.1 2,046.1
Change in cash and cash equivalents (138.1) 1,283.0 992.7
Cash and cash equivalents at beginning of year 2,740.2 1,457.2 464.5
Cash and cash equivalents at end of year $ 2,602.1 $ 2,740.2 $ 1,457.2
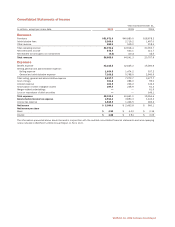
The information presented above should be read in conjunction with the audited consolidated financial statements and accompanying
notes included in WellPoint’s 2006 Annual Report on Form 10-K.