Anthem Blue Cross 2006 Annual Report Download - page 29
Download and view the complete annual report
Please find page 29 of the 2006 Anthem Blue Cross annual report below. You can navigate through the pages in the report by either clicking on the pages listed below, or by using the keyword search tool below to find specific information within the annual report.-
 1
1 -
2
-
3
-
4
-
5
-
6
-
7
-
8
-
9
-
10
-
11
-
12
-
13
-
14
-
15
-
16
-
17
-
18
-
 19
19 -
 20
20 -
 21
21 -
 22
22 -
 23
23 -
 24
24 -
 25
25 -
 26
26 -
 27
27 -
 28
28 -
 29
29 -
 30
30 -
 31
31 -
 32
32 -
 33
33 -
 34
34 -
 35
35 -
 36
36
 |
 |

26-27
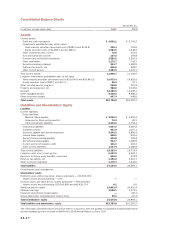
Consolidated Balance Sheets
December 31,
In millions, except share data 2006 2005
Assets
Current assets:
Cash and cash equivalents $ 2,602.1 $ 2,740.2
Investments available-for-sale, at fair value:
Fixed maturity securities (amortized cost of $481.5 and $734.8) 465.4 734.6
Equity securities (cost of $1,669.7 and $1,388.4) 1,984.5 1,448.2
Other invested assets, current 72.8 307.0
Accrued investment income 157.2 156.8
Premium and self-funded receivables 2,520.2 2,216.4
Other receivables 1,172.7 743.7
Securities lending collateral 904.7 1,389.9
Deferred tax assets, net 642.6 689.0
Other current assets 1,284.5 1,022.7
Total current assets 11,806.7 11,448.5
Long-term investments available-for-sale, at fair value:
Fixed maturity securities (amortized cost of $15,004.6 and $14,941.0) 14,972.4 14,825.5
Equity securities (cost of $82.7 and $71.3) 86.2 72.7
Other invested assets, long-term 628.8 207.8
Property and equipment, net 988.6 1,078.6
Goodwill 13,383.5 13,469.1
Other intangible assets 9,396.2 9,686.4
Other noncurrent assets 497.4 498.6
Total assets $51,759.8 $51,287.2
Liabilities and Shareholders’ Equity
Liabilities
Current liabilities:
Policy liabilities:
Medical claims payable $ 5,290.3 $ 4,853.4
Reserves for future policy benefits 76.3 82.1
Other policyholder liabilities 2,240.6 1,752.3
Total policy liabilities 7,607.2 6,687.8
Unearned income 987.9 1,057.1
Accounts payable and accrued expenses 3,242.2 2,860.4
Income taxes payable 538.2 833.4
Security trades pending payable 124.8 181.8
Securities lending payable 904.7 1,389.9
Current portion of long-term debt 521.0 481.2
Other current liabilities 1,397.4 1,286.8
Total current liabilities 15,323.4 14,778.4
Long-term debt, less current portion 6,493.2 6,324.7
Reserves for future policy benefits, noncurrent 646.9 679.9
Deferred tax liability, net 3,350.2 3,267.1
Other noncurrent liabilities 1,370.3 1,244.0
Total liabilities 27,184.0 26,294.1
Commitments and contingencies
Shareholders’ equity
Preferred stock, without par value, shares authorized — 100,000,000;
shares issued and outstanding — none — —
Common stock, par value $0.01, shares authorized — 900,000,000;
shares issued and outstanding: 615,500,865 and 660,424,174 6.1 6.6
Additional paid-in capital 19,863.5 20,915.4
Retained earnings 4,656.1 4,173.5
Unearned share-based compensation — (82.1)
Accumulated other comprehensive income (loss) 50.1 (20.3)
Total shareholders’ equity 24,575.8 24,993.1
Total liabilities and shareholders’ equity $51,759.8 $51,287.2
The information presented above should be read in conjunction with the audited consolidated financial statements
and accompanying notes included in WellPoint’s 2006 Annual Report on Form 10-K.