Anthem Blue Cross 2005 Annual Report Download - page 31
Download and view the complete annual report
Please find page 31 of the 2005 Anthem Blue Cross annual report below. You can navigate through the pages in the report by either clicking on the pages listed below, or by using the keyword search tool below to find specific information within the annual report.-
 1
1 -
2
-
3
-
4
-
5
-
6
-
7
-
8
-
9
-
10
-
11
-
12
-
13
-
14
-
15
-
16
-
17
-
18
-
19
-
20
-
 21
21 -
 22
22 -
 23
23 -
 24
24 -
 25
25 -
 26
26 -
 27
27 -
 28
28 -
 29
29 -
 30
30 -
 31
31 -
 32
32 -
 33
33 -
 34
34 -
 35
35 -
 36
36
 |
 |
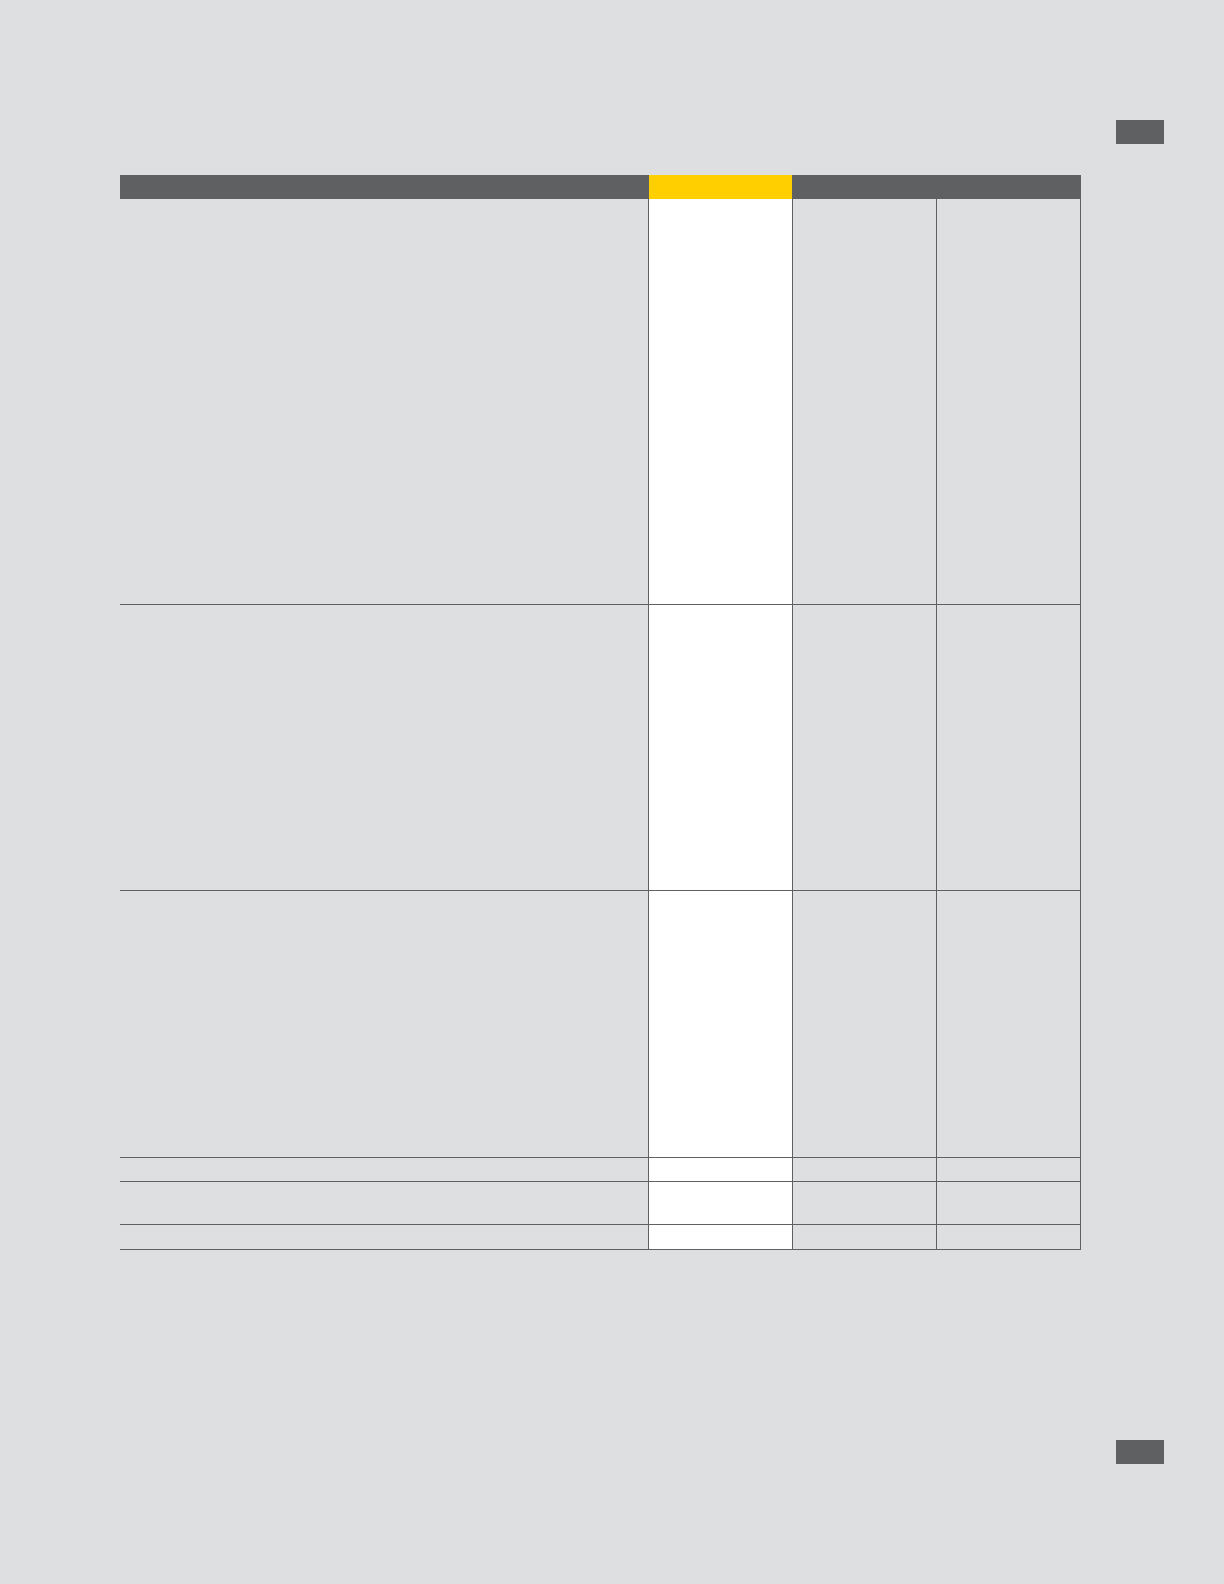
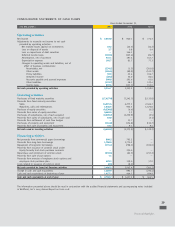
consolidated statements of cash flows
Years Ended December 31,
(in millions)2005 2004 2003
Operating activities
Net income $ 2,463.8 $ 960.1 $ 774.3
Adjustments to reconcile net income to net cash
provided by operating activities:
Net realized losses (gains) on investments 10.2 (42.5) (16.2)
Loss on disposal of assets 2.7 0.8 0.4
Loss on repurchase of debt securities —146.1 —
Deferred income taxes (102.6) (103.4) (26.7)
Amortization, net of accretion 531.1 197.4 167.7
Depreciation expense 102.7 81.7 77.3
Changes in operating assets and liabilities, net of
effect of business combinations:
Receivables, net (234.1) (1.3) (201.8)
Other assets (165.6) (89.9) (141.7)
Policy liabilities 50.0 25.6 104.7
Unearned income (38.2) 34.0 84.6
Accounts payable and accrued expenses 309.8 191.6 61.0
Other liabilities (132.7) 28.5 123.4
Income taxes 459.6 (125.5) 152.0
Net cash provided by operating activities 3,256.7 1,303.2 1,159.0
Investing activities
Purchases of fixed maturity securities (17,457.0) (7,242.7) (5,135.8)
Proceeds from fixed maturity securities:
Sales 14,391.4 6,273.5 2,444.2
Maturities, calls and redemptions 1,344.5 952.5 1,670.8
Purchase of equity securities (4,530.6) (6.6) (0.5)
Proceeds from sales of equity securities 4,480.0 1.3 —
Purchases of subsidiaries, net of cash acquired (2,589.7) (2,239.9) (3.5)
Proceeds from sales of subsidiaries, net of cash sold 92.8 — (3.1)
Proceeds from settlement of cash flow hedges —15.7 —
Purchases of property and equipment (161.8) (136.8) (110.7)
Proceeds from sale of property and equipment 10.2 9.1 9.4
Net cash used in investing activities (4,420.2) (2,373.9) (1,129.2)
Financing activities
Net proceeds from commercial paper borrowings 808.2 793.2 —
Proceeds from long-term borrowings 1,700.0 1,770.2 —
Repayment of long-term borrowings (155.1) (798.5) (100.0)
Proceeds from issuance of common stock under
Equity Security Unit stock purchase contracts —230.0 —
Repurchase and retirement of common stock (333.4) (82.3) (217.2)
Proceeds from sale of put options 1.1 ——
Proceeds from exercise of employee stock options and
employee stock purchase plan 429.3 159.0 57.0
Costs related to issuance of common stock (3.6) (8.2) —
Net cash provided by (used in) financing activities 2,446.5 2,063.4 (260.2)
Change in cash and cash equivalents 1,283.0 992.7 (230.4)
Cash and cash equivalents at beginning of year 1,457.2 464.5 694.9
Cash and cash equivalents at end of year $ 2,740.2 $ 1,457.2 $ 464.5
The information presented above should be read in conjunction with the audited financial statements and accompanying notes included
in WellPoint, Inc.’s 2005 Annual Report on Form 10-K.
29
Financial Highlights