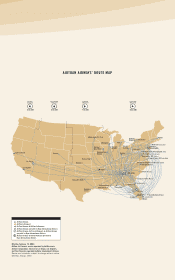
Airtran 2003 Annual Report Download - page 19
Download and view the complete annual report
Please find page 19 of the 2003 Airtran annual report below. You can navigate through the pages in the report by either clicking on the pages listed below, or by using the keyword search tool below to find specific information within the annual report.-
 1
1 -
2
-
3
-
4
-
5
-
6
-
7
-
8
-
 9
9 -
 10
10 -
 11
11 -
 12
12 -
 13
13 -
 14
14 -
 15
15 -
 16
16 -
 17
17 -
 18
18 -
 19
19 -
 20
20 -
 21
21 -
 22
22 -
 23
23 -
 24
24 -
 25
25 -
 26
26 -
 27
27 -
 28
28 -
 29
29 -
30
-
31
-
32
-
33
-
34
-
35
-
36
-
37
-
38
-
39
-
40
-
41
-
42
-
43
-
44
-
45
-
46
 |
 |
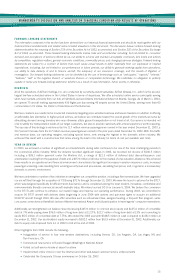
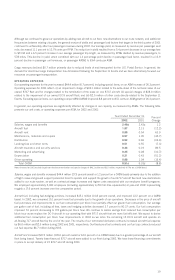
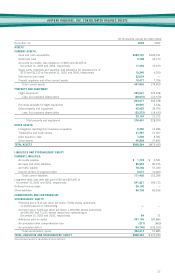
Salaries, wages and benefits increased $28.3 million (13.9 percent overall or a decrease of 6.1 percent on a CASM basis) primarily
due to the addition of flight crews and ground support personnel hired to operate and support the growth of our B717 aircraft fleet
and new destinations added to our route system, as well as contractual wage increases and higher costs associated with our employee
benefit programs. We employed approximately 5,500 employees (including approximately 5,300 full-time equivalents) at year-end
2003 representing roughly a 16.8 percent increase over the comparative period.
Aircraft fuel, including fuel-hedging activities, increased $24.3 million (15.7 percent overall, and improved 4.8 percent on a CASM
basis). In 2003, we consumed 6.3 percent more fuel primarily due to the growth of our operations. We also experienced increases in
the price of aircraft fuel purchases. Improvements to our fuel consumption per block hour partially offset our greater fuel consumption
and the price increases. Our average per gallon cost of fuel, including all fees, taxes and hedging activities increased 8.9 percent to
98.4 cents. Our fuel consumption improved 8.7 percent decreasing to 659 gallons per block hour compared to 722 gallons per block
hour in 2002. We continue to realize savings from reduced fuel consumption per block hour as we replace the DC-9 aircraft in our
operating fleet with B717 aircraft that are more fuel-efficient. The results of our terminated derivative contracts increased aircraft fuel
expense by $0.5 million and $6.0 million during 2003 and 2002, respectively. Our fixed-price fuel contracts and fuel cap contracts
reduced our fuel expense by $7.4 million and $4.7 million during 2003 and 2002, respectively.
Aircraft rent increased $51.5 million (70.9 percent overall or 40.9 percent on a CASM basis) due to a greater percentage of our aircraft
fleet being leased. Twenty-three lease-financed B717 aircraft were added to our fleet during 2003. We have lease-financing commitments
in place to accept delivery of six B737 aircraft and six B717 aircraft during 2004.
Maintenance, materials and repairs increased $16.3 million (34.5 percent or 10.5 percent on a CASM basis). On a block hour basis,
maintenance costs increased 15.5 percent to approximately $231 per block hour. Prior to 2003, the B717 aircraft parts and components
were under warranty. During 2003, we commenced payments under previously negotiated agreements covering the maintenance,
repair and overhaul of major B717 aircraft engine, parts and components. Under these agreements, we pay monthly fees based on
either the number of flight hours flown or the number of landings made. Under these contracts, maintenance costs are expensed
monthly as the aircraft is utilized.
Distribution costs increased $2.2 million (5.2 percent overall or improved 13.5 percent on a CASM basis). Our improvement in this
area, on a CASM basis, was primarily due to: (i) a greater percentage of our passenger sales being generated online via our website;
and (ii) savings generated by revisions to our commission structure. We recognize significant savings when our sales are transacted
via our website as opposed to more traditional methods such as through travel agents and global distribution systems. During 2002, we
revised our commission structure to eliminate the standard 5 percent commission for travel agencies. We continue to offer a 5 percent
commission for sales transacted through the travel agent section of our website. Our commission cost savings was partially offset by
increased computer reservation system and credit card fees. The additional transaction volume derived from our growth in revenue
passengers generated the escalation in these fees.
Landing fees and other rents increased $10.5 million (24.9 percent, and 2.0 percent on a CASM basis) reflecting landing fee rate
increases, growth in the number of flights we operated and the leasing of facilities at the new destinations added to our route network.
Aircraft insurance and security services declined $9.6 million (32.9 percent or 44.4 percent on a CASM basis) primarily from a significant
reduction in aircraft hull and passenger liability insurance rates in 2003, despite increases in the insured fleet hull value as a result of
the new B717 aircraft deliveries.
Marketing and advertising increased $3.1 million (15.0 percent, and improved 4.0 percent on a CASM basis) primarily reflecting our
promotional efforts associated with the development of our new destinations and efforts to generate demand in all markets.
Depreciation decreased $4.4 million (26.0 percent or 38.1 percent on a CASM basis) primarily due to the retirement of 9 and 14 owned
aircraft during 2003 and 2002, respectively.
Other operating expenses increased $6.7 million (9.3 percent, and improved 11.4 percent on a CASM basis) primarily from added
passenger-related costs associated with the higher level of operations, contractual costs related to the opening of new destinations and
the costs associated with our new reservations system and other automation projects.
NON-OPERATING EXPENSES
Other (income) expense, net decreased by $21.4 million primarily due to the receipt of a government reimbursement pursuant to the
Wartime Act of $38.1 million, partially offset by a $12.3 million charge related to the write off of unamortized debt discount and issuance
costs due to the early retirement of debt and of conversion of debt to equity (see Note 7 to the Consolidated Financial Statements).
Additionally, interest expense decreased by approximately $1 million due to the payoff of high interest rate debt and the issuance of
lower interest rate debt. Interest income increased approximately $1.2 million due to higher cash balances available for investment.
17