Air New Zealand 2010 Annual Report Download - page 54
Download and view the complete annual report
Please find page 54 of the 2010 Air New Zealand annual report below. You can navigate through the pages in the report by either clicking on the pages listed below, or by using the keyword search tool below to find specific information within the annual report.-
 1
1 -
2
-
3
-
4
-
5
-
6
-
7
-
8
-
9
-
10
-
11
-
12
-
13
-
14
-
15
-
16
-
17
-
18
-
19
-
20
-
21
-
22
-
23
-
24
-
25
-
26
-
27
-
28
-
29
-
30
-
31
-
32
-
33
-
34
-
35
-
36
-
37
-
38
-
39
-
40
-
41
-
42
-
43
-
 44
44 -
 45
45 -
 46
46 -
 47
47 -
 48
48 -
 49
49 -
 50
50 -
 51
51 -
 52
52 -
 53
53 -
 54
54 -
 55
55 -
 56
56 -
 57
57 -
 58
58 -
 59
59 -
 60
60 -
 61
61 -
 62
62 -
 63
63 -
 64
64 -
65
-
66
-
67
-
68
-
69
-
70
-
71
-
72
-
73
-
74
-
75
-
76
 |
 |
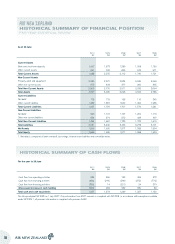
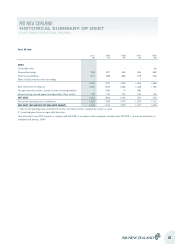
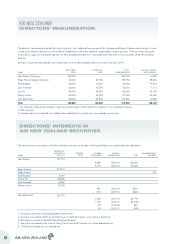
As at 30 June
2010
$M
2009
$M
2008
$M
2007
$M
2006
$M
Current Assets
Bank and short term deposits 1,067 1,573 1,289 1,058 1,150
Other current assets 621 702 823 672 571
Total Current Assets 1,688 2,275 2,112 1,730 1,721
Non-Current Assets
Property, plant and equipment 2,230 2,337 2,534 2,636 2,669
Other non-current assets 679 433 377 300 395
Total Non-Current Assets 2,909 2,770 2,911 2,936 3,064
Total Assets 4,597 5,045 5,023 4,666 4,785
Current Liabilities
Net debt1175 172 158 116 345
Other current liabilities 1,432 1,587 1,549 1,460 1,236
Total Current Liabilities 1,607 1,759 1,707 1,576 1,581
Non-Current Liabilities
Net debt1900 1,107 1,167 1,269 1,113
Other non-current liabilities 524 574 572 433 497
Total Non-Current Liabilities 1,424 1,681 1,739 1,702 1,610
Total Liabilities 3,031 3,440 3,446 3,278 3,191
Net Assets 1,566 1,605 1,577 1,388 1,594
Total Equity 1,566 1,605 1,577 1,388 1,594
1. Net debt is comprised of bank overdraft, borrowings, finance lease liabilities and convertible notes.
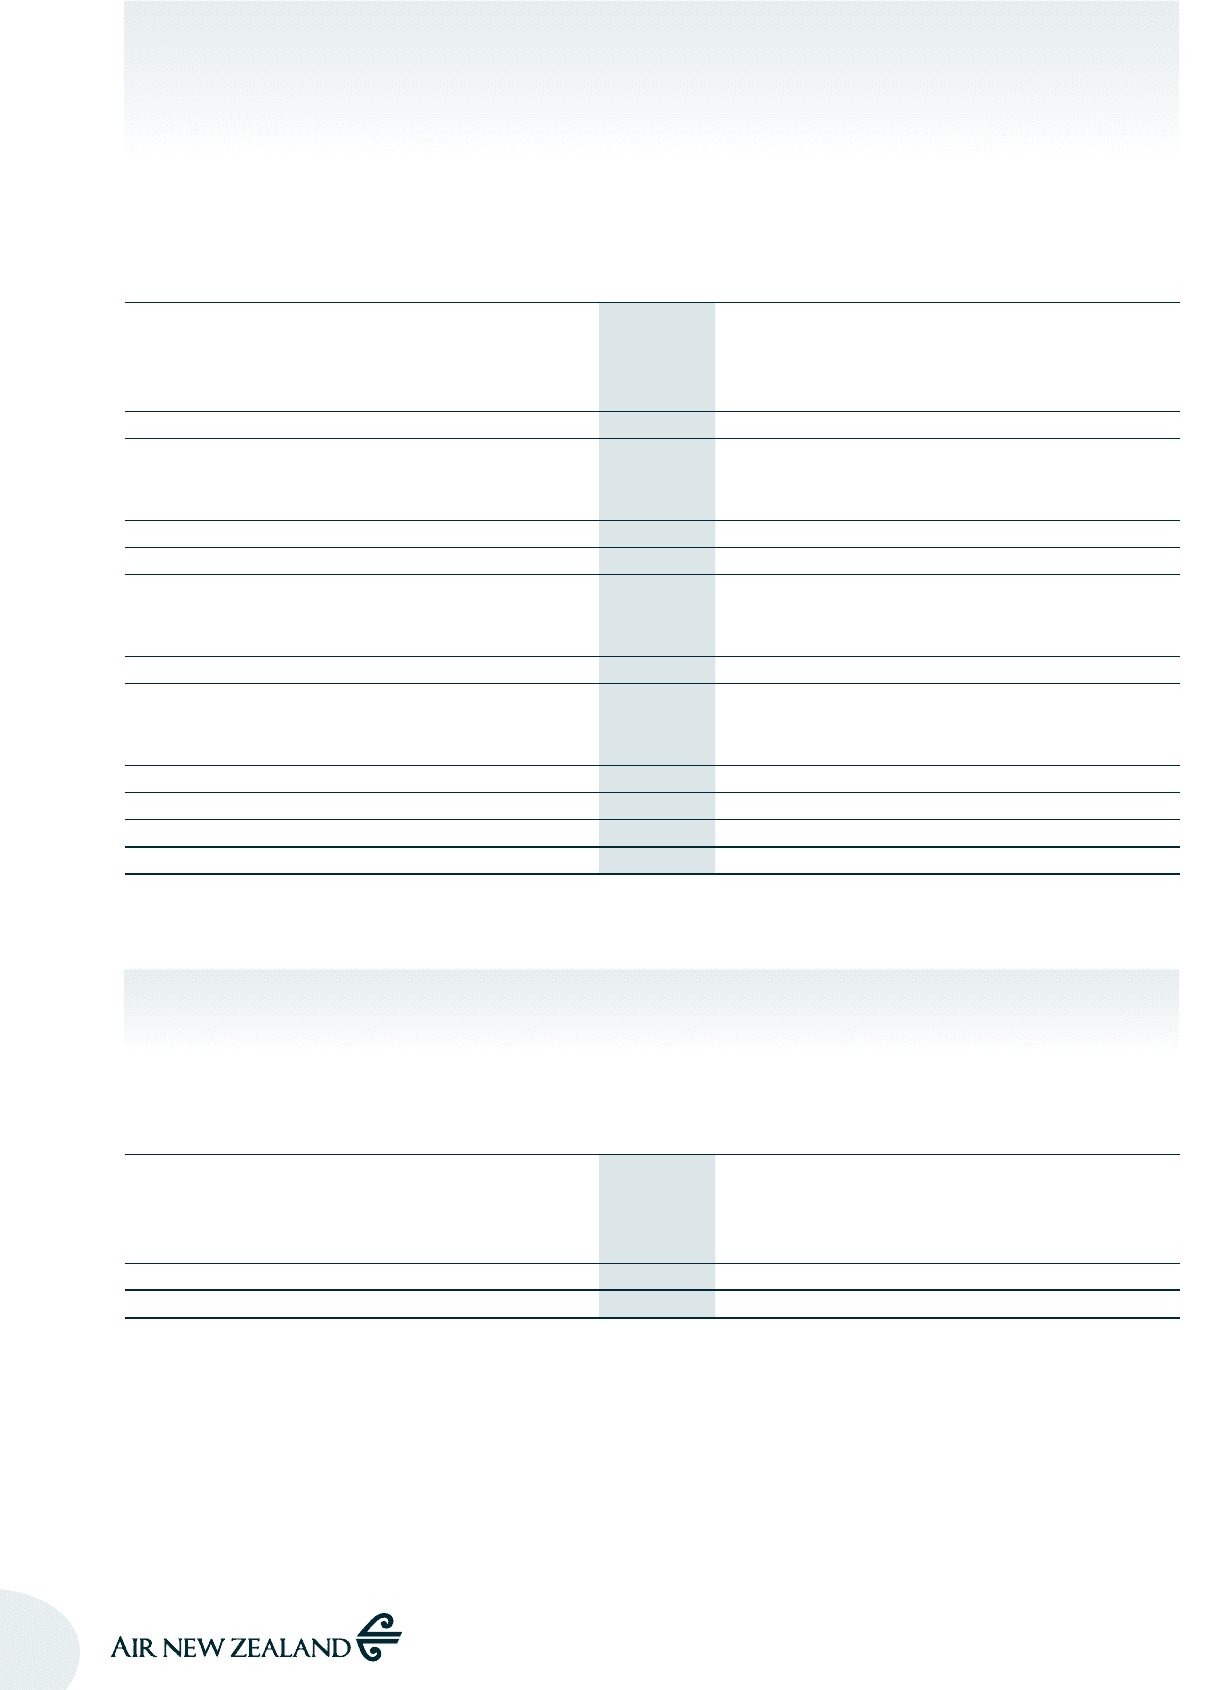
HISTORICAL SUMMARY OF CASH FLOWS
For the year to 30 June
2010
$M
2009
$M
2008
$M
2007
$M
2006
$M
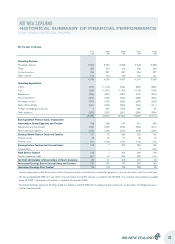
Cash flow from operating activities 334 486 743 455 473
Cash flow from investing activities (450) (216) (290) (572) (772)
Cash flow from financing activities (390) 14 (221) 24 379
(Decrease)/increase in cash holding (506) 284 232 (93) 80
Total cash and cash equivalents 1,067 1,573 1,289 1,057 1,150
The Group adopted NZ IFRS on 1 July 2007. Only information from 2007 onwards is compliant with NZ IFRS. In accordance with exemptions available
under NZ IFRS 1, all previous information is compliant with previous GAAP.
AIR NEW ZEALAND
HISTORICAL SUMMARY OF FINANCIAL POSITION
FIVE YEAR STATISTICAL REVIEW
52