Adidas 2000 Annual Report Download - page 8
Download and view the complete annual report
Please find page 8 of the 2000 Adidas annual report below. You can navigate through the pages in the report by either clicking on the pages listed below, or by using the keyword search tool below to find specific information within the annual report.-
 1
1 -
 2
2 -
 3
3 -
 4
4 -
 5
5 -
 6
6 -
 7
7 -
 8
8 -
 9
9 -
 10
10 -
 11
11 -
 12
12 -
 13
13 -
 14
14 -
 15
15 -
 16
16 -
 17
17 -
 18
18 -
 19
19 -
20
-
21
-
22
-
23
-
24
-
25
-
26
-
27
-
28
-
29
-
30
-
31
-
32
-
33
-
34
-
35
-
36
-
37
-
38
-
39
-
40
-
41
-
42
-
43
-
44
-
45
-
46
-
47
-
48
-
49
-
50
-
51
-
52
-
53
-
54
-
55
-
56
-
57
-
58
-
59
-
60
-
61
-
62
-
63
-
64
-
65
-
66
-
67
-
68
-
69
-
70
-
71
-
72
-
73
-
74
-
75
-
76
-
77
-
78
-
79
-
80
-
81
-
82
-
83
-
84
-
85
-
86
-
87
-
88
-
89
-
90
-
91
-
92
-
93
-
94
-
95
-
96
-
97
-
98
-
99
-
100
-
101
-
102
-
103
-
104
-
105
-
106
-
107
-
108
-
109
-
110
-
111
-
112
-
113
-
114
 |
 |

4
Shareholder Information
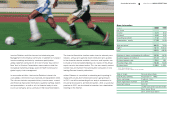
Solid Development of adidas-Salomon Share
Despite a turbulent year on the stock markets, the adidas-
Salomon share price developed favorably in the second half
of 2000. At year-end the share price was c66.00, down 11%
from 1999 year-end, but up 32% from its first quarter low.
This performance was slightly lower than the German DAX-30
Index, which declined 8% over the same period, and clearly
behind the Standard & Poor’s SuperCap Footwear Index, a
composite of the Group’s major footwear competitors in
America, which increased 30% over the year as a result of the
rebounding sporting goods environment in the United States.
First quarter declines in the adidas-Salomon share price
were driven by company, industry and market factors. At
adidas-Salomon, Management changes and the c 38 million
Growth and Efficiency Program were announced. Profit warn-
ings were issued in the industry, which pushed share prices
down dramatically. In addition, interest rate increases and
mixed economic signals in the United States and the falling
euro raised overall market skepticism.
As the year progressed, however, confidence in the new Man-
agement’s plans increased, the athletic footwear retail
industry
consolidated and strengthened in the United States and
investor
insecurity
about the “new economy” drove increased interest
in our share and industry. Analyst sentiment also improved.
adidas-Salomon outperformed the DAX-30 after the first
quarter and showed consistent improvement, gaining strongest
momentum in the fourth quarter. In November, adidas-Salomon
was the top performer in the DAX-30. The adidas-Salomon
share price continued to appreciate in early 2001.
Dividend Sustained at g0.92
The adidas-Salomon Executive Board will propose paying a
dividend of c0.92 per share to the Annual General Meeting
of Shareholders on May 10, the same amount as in 1999.
This represents a total payout of approximately c42 million.
The decision to maintain a stable dividend level represents
Management’s confidence in its ability to achieve its 2001
financial targets, despite the net income decline in 2000.
The proposal represents a total payout ratio of 23%, which is
above the defined range of the Company’s dividend policy,
which recommends a payout ratio of between 15 and 20% of
consolidated net income. Management views 2000 as a year
of consolidation and restructuring and is increasing the payout
percentage to reward long-term shareholders. In 2001 and
beyond, adidas-Salomon will return to a dividend payout ratio
consistent with its established dividend policy.
Investor Relations Program Extends Offering
Open and consistent communication with shareholders, poten-
tial investors and other members of the financial community is
a high priority for adidas-Salomon. In addition, the transition of
new Management in 2000 brought a strong mandate to extend
and strengthen our relationship with each of these important
groups. It is our belief that this communication is critical to a
fair valuation of the adidas-Salomon share.
Dividend Payout Ratio
(in % of Net Income)
2000
1999
1998
1997
1996
0 5 10 15 20 25
*
Target range
* Before special effect
2000 Monthly Share Price Development
140
120
100
80
60
Jan Feb Mar Apr May Jun Jul Aug Sep Oct Nov Dec
adidas-Salomon
DAX-30 Index
Standard & Poor’s SuperCap Footwear Index
2000 Quarterly DAX-30 Comparison
(in %)
10
0
–10
–20
Q1/00 Q2/00 Q3/00 Q4/00
adidas-Salomon
DAX