Abercrombie & Fitch 2001 Annual Report Download - page 8
Download and view the complete annual report
Please find page 8 of the 2001 Abercrombie & Fitch annual report below. You can navigate through the pages in the report by either clicking on the pages listed below, or by using the keyword search tool below to find specific information within the annual report.-
 1
1 -
 2
2 -
 3
3 -
 4
4 -
 5
5 -
 6
6 -
 7
7 -
 8
8 -
 9
9 -
 10
10 -
 11
11 -
 12
12 -
 13
13 -
 14
14 -
 15
15 -
 16
16 -
 17
17 -
 18
18
 |
 |

15
expenses as a result of the decrease in comparable store sales. The
increase was also due to planned one-time expenses related to the
C o m p a n y’s move to a new home office and distribution center. The
increases were offset by tightly controlled headcount additions,
travel expenses, store payroll hours, outside services and compen-
sation expense related to management bonuses.
The general, administrative and store operating expenses rate
for the year was 21.0%, 20.7% and 20.2% in 2001, 2000 and
1999, respectively. The rate increases in 2001 and 2000 were pri-
marily due to the inability to leverage fixed expenses as a result
of the decrease in sales volume per average store. The increases
were partially offset by the Company’s continued focus on dis-
c r e t i o n a ry expense controls.
OPERATING INCOME The operating income rate (operating
income divided by net sales) was 27.6% and 19.9% for the fourth
quarter and fiscal year of 2001, respectively, compared to 28.2%
and 20.5% for the same periods in 2000. The decline in operat-
ing income rate in these periods was primarily due to lower
gross income percentages resulting from planned promotional
strategies executed in the fourth quarter. Lower general, admin-
istrative and store operating expenses, expressed as a percentage
of net sales, partially offset the lower gross income rate in the
fourth quarter. For the year, higher general, administrative and
store operating expenses, expressed as a percentage of net sales,
added to the decrease in operating income rate.
Operating income, expressed as a percentage of net sales, was
28.2% and 20.5% for the fourth quarter and fiscal year of 2000,
r e s p e c t i v e l y, compared to 34.5% and 23.5% for the same periods
in 1999. The decline in operating income as a percentage of net
sales in these periods was primarily a result of lower gross income
percentages. Higher general, administrative and store operating
expenses, expressed as a percentage of net sales, also added to the
decrease in the operating income percentage of net sales.
INTEREST INCOME/EXPENSE Net interest income was $1.2
million in the fourth quarter of 2001 and $5.1 million for the 2001
fiscal year compared with net interest income of $2.5 million and
$7.8 million for the corresponding periods last year. The decrease
in net interest income for both the quarter and the year was due
to the decline in interest rates. Net interest income in 2001 and
2000 was primarily from short-term investments.
Net interest income was $2.5 million in the fourth quarter of
2000 and $7.8 million for all of 2000 compared with net interest
income of $2.5 million and $7.3 million for the corresponding peri-
ods in 1999. The increase in net interest income for the year was
due to an increase in interest rates, which was partially offset by
lower cash and equivalents balances. Net interest income in 2000
and 1999 was primarily from short-term investments.
FINANCIAL CONDITION The Company's continuing growth
in net income affords it financial strength and flexibility. A
more detailed discussion of liquidity, capital resources and cap-
ital requirements follows.
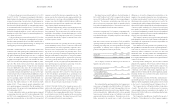
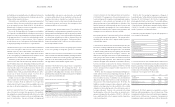
LIQUIDITY AND CAPITAL RESO U R C E S Cash provided by
operating activities provides the resources to support operations,
including projected growth, seasonal requirements and capital
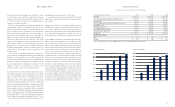
expenditures. A summary of the Company's working capital
position and capitalization follows (thousands):
2001 2000 1999
Working capital $241,616 $146,939 $1 6 2 , 351
Capitalization:
Shareholders’ equity $595,434 $422,700 $311,094
The Company considers the following to be measures of
liquidity and capital resources:
2001 2000 1999
Current ratio (current assets divided
by current liabilities) 2.48 1.94 2.18
Cash flow to capital investment
(net cash provided by operating
activities divided by capital expenditures) 184% 99% 208%
Free cash flow (net cash provided by operating
activities less capital expenditures)
(in thousands) $106,687 ($2,292) $79,374
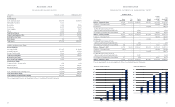
Net cash provided by operating activities, the Company’s pri-
m a ry resource of liquidity, totaled $233.2 million, $151.2 million
and $152.8 million for 2001, 2000 and 1999, respectively. Cash was
provided primarily by current year net income adjusted for depre-
ciation and amortization. Additionally in 2001, cash was provided
from increases in deferred income tax liabilities and accru e d
expenses and decreases in inventories. Deferred income tax lia-
bilities increased in the current year as a result of increasing
Ab e r cro mb i e&Fitch
14
For the year, the gross income rate decreased to 40.9% in 2001
from 41.2% in 2000. The decrease was primarily attributable to
higher buying and occupancy costs. Buying and occupancy costs
increased, as a percentage of net sales, due to the deleveraging cre-
ated by the decrease in comparable store sales. The decrease was
almost entirely offset by higher IMU as continued improvements
in sourcing merchandise have reduced costs. The other factors in
protecting gross income were tight control of inventory, which
resulted in disciplined markdown control, and lower inventory
shrinkage as a result of the Company’s continued emphasis on in-
store operational controls.
For the year, the gross income rate decreased to 41.2% in 2000
from 43.7% in 1999. The decrease was attributable to lower mer-
chandise margins, primarily due to lower IMU caused by both a
change in sales mix and the planned strategy of offering lower
opening price points in key product classifications.
G E N E RAL, ADMINISTRATIVE AND STORE OPERAT I N G
E X P E N S E S The fourth quarter general, administrative and store
operating expenses rate (general, administrative and store operat-
ing expenses divided by net sales) improved to 17.1% as compared
to 17.9% in the fourth quarter of 2000. The Company continues
to tightly control expenses in both the stores and the home office.
These cost controls include limiting headcount additions, reduc-
ing home office travel and store payroll hours, and decreasing
relocation and recruiting expenses. Savings were also recognized
in the new distribution center and in the e-commerce business.
During the fourth quarter, productivity in the distribution center,
as measured in units processed per labor hour, was over 50% high-
er than last year. In the e-commerce business, fulfillment costs per
order were down by over 10%. Last year’s general, administrative
and store operating expenses were unfavorably affected by one-
time expenses related to the move to the new distribution center
and home office and the inclusion of a 14th week in the fourth
quarter of 2000. These savings in general, administrative and
store operating expenses were partially offset by marketing costs
incurred as part of the promotional strategy implemented during
the fourth quarter of 2001.
General, administrative and store operating expenses, expressed
as a percentage of net sales, were 17.9% in the fourth quarter of 2000
and 16.4% in the comparable period in 1999. The increase in the
percentage was primarily due to the inability to leverage fixed
Ab e rcr ombi e &Fitch
differences in tax and book depreciation methods due to the
number of stores opened in the past few years. Ac c rued expenses,
including unredeemed gift card revenue and catalogue and
advertising costs, increased in the current year as a result of the
continued growth and development of the business. Inventories
decreased $12.1 million during 2001 due to the tight management
of inventory, which resulted in a 30% decrease in inventory per
gross square foot at year-end. Uses of cash were directly related
to store growth and primarily consisted of increases in capitalized
store supplies, construction allowance receivables and prepaid rent
related to stores (classified in other assets).
The Company’s operations are seasonal in nature and typically
peak during the back-to-school and Christmas selling periods.
Accordingly, cash requirements for inventory expenditures are
highest during these periods.
Cash outflows for investing activities were primarily for cap-
ital expenditures (see the discussion in the “Capital Expenditures”
section below) related to new stores (net of constru c t i o n
allowances) and the construction costs of the new office and
distribution center. Investing activities also included purchases
and maturities of marketable securities. As of Fe b ru a ry 2, 2002,
the Company held marketable securities with original maturities
of three to five months.
Financing activities during 2001, 2000 and 1999 consisted
primarily of the repurchase of 600,000 shares, 3,550,000 shares and
1,510,000 shares, respectively, of A&F’s Class A Common Stock
pursuant to previously authorized stock repurchase programs. As
of February 2, 2002, A&F is authorized to repurchase up to an
additional 1,850,000 shares under the current repurchase program.
Financing activities also consisted of stock option exercises and
restricted stock issuances.
The Company has available a $150 million syndicated unse-
cured credit agreement. No amounts are currently outstanding.
Additional details regarding the credit agreement can be found
in the Notes to Consolidated Financial Statements (Note 8).
The Company also has a $75 million facility for trade letters
of credit. The trade letters of credit are issued to numerous
overseas suppliers and serve as guarantees to the suppliers. As of
Fe b ru a ry 2, 2002, $39.7 million was outstanding under this trade
letter of credit facility.
The Company has standby letters of credit in the amount of
$8.5 million. The beneficiaries, two of the Company’s suppliers,