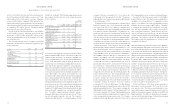
Abercrombie & Fitch 2001 Annual Report Download - page 6
Download and view the complete annual report
Please find page 6 of the 2001 Abercrombie & Fitch annual report below. You can navigate through the pages in the report by either clicking on the pages listed below, or by using the keyword search tool below to find specific information within the annual report.-
 1
1 -
 2
2 -
 3
3 -
 4
4 -
 5
5 -
 6
6 -
 7
7 -
 8
8 -
 9
9 -
 10
10 -
 11
11 -
 12
12 -
 13
13 -
 14
14 -
 15
15 -
 16
16 -
 17
17 -
18
 |
 |

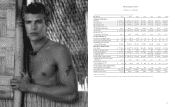
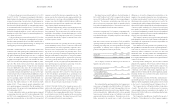
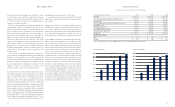
11
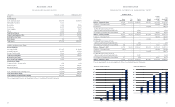
(Thousands except per share and per square foot amounts, ratios and store and associate data)
Fiscal Year 2001 2000* 1999 1998 1997 1996 1995*
Summary of Operations
Net Sales $1,364,853 $1,237,604 $1,030,858 $805,180 $513,109 $329,800 $232,415
Gross Income $ 558,034 $ 509,375 $1,450,383 $331,354 $191,890 $118,194 $076,550
Operating Income $ 271,458 $ 253,652 $1,242,064 $166,958 $084,125 $045,993 $ 23,798
Operating Income as a
Percentage of Net Sales 19.9% 20.5% 23.5% 20.7% 16.4% 13.9% 10.2%
Net Income $ 168,672 $ 158,133 $1,149,604 $102,062 $048,322 $024,674 $ 14,298
Net Income as a
Percentage of Net Sales 12.4% 12.8% 14.5% 12.7% 9.4% 7.5% 6.2%
Per Share Results (1)
Net Income Per Basic Share $ 1.70 $000 1.58 $ $0001.45 $0000.99 $0000.47 $000 .27 $000 .17
Net Income Per Diluted Share $ 1.65 $0000 1.55 $ $0001.39 $0000.96 $0000.47 $000 .27 $000 .17
Weighted Average Diluted
Shares Outstanding 102,524 0102,156 $107,641 0106,202 0102,956 $091,520 $086,000
Other Financial Information
Total Assets $7 7 0 ,546 $ 589,577 $1,458,166 $319,161 $183,238 $105,761 $ 87,693
Return on Average Assets 25% 30% 38% 41% 33% 26% 20%
Capital Expenditures $ 126,515 $0153,481 $1,073,377 $ 37,483 $ 29,486 $ 24,323 $ 24,526
Long-Term Debt –– – – $ 50,000 $ 50,000 –
Shareholders’ Equity (Deficit) $ 595,434 $ 422,700 $1,311,094 $186,105 $ 58,775 $ 11,238 $ (22,622)
Comparable Store Sales Increase
(Decrease) (9%) (7%) 10% 35% 21% 13% 5%
Retail Sales Per Average
Gross Square Foot $ 401 $00 0,474 $1,000,505 $ 476 $ 370 $ 301 $ 286
Stores and Associates at End of Year
Total Number of Stores Open 491 354 250 196 156 127 100
Gross Square Feet 3,673,000 2,849,000 2,174,000 1,791,000 1,522,000 1,229,000 962,000
Number of Associates 16,700 13,900 011,300 9,500 6,700 4,900 3,000
*Fifty-three week fiscal year.
(1) Per share amounts have been restated to reflect the two-for-one stock split on A&F’s Class A Common Stock, distributed on June 15, 1999.
F INANCIAL SUMMARY
Ab e rcrombi e &Fitch