Abercrombie & Fitch 2001 Annual Report Download - page 11
Download and view the complete annual report
Please find page 11 of the 2001 Abercrombie & Fitch annual report below. You can navigate through the pages in the report by either clicking on the pages listed below, or by using the keyword search tool below to find specific information within the annual report.-
 1
1 -
 2
2 -
 3
3 -
 4
4 -
 5
5 -
 6
6 -
 7
7 -
 8
8 -
 9
9 -
 10
10 -
 11
11 -
 12
12 -
 13
13 -
 14
14 -
 15
15 -
 16
16 -
 17
17 -
 18
18
 |
 |

2120
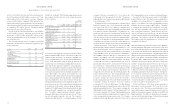
Ab e r cr omb i e&Fitch Ab e rcrombi e &Fitch
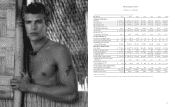
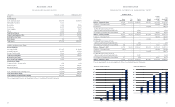
(Thousands) February 2, 2002 February 3, 2001
Assets
Current Assets
Cash and Equivalents $167,664 $137,581
Marketable Securities 71,220 –
Receivables 20,456 15,829
Inventories 108,876 120,997
Store Supplies 21,524 17,817
Other 15,455 11,338
Total Current Assets 405,195 303,562
Property and Equipment, Net 365,112 278,785
Deferred Income Taxes –6,849
Other Assets 239 381
Total Assets $770,546 $589,577
Liabilities and Shareholders’ Equity
Current Liabilities
Accounts Payable $031,897 $033,942
Accrued Expenses 109,586 101,302
Income Taxes Payable 22,096 21,379
Total Current Liabilities 163,579 156,623
Deferred Income Taxes 1,165 –
Other Long-Term Liabilities 10,368 10,254
Shareholders’ Equity
Common Stock – $.01 par value 1,033 1,033
Paid-In Capital 141,394 136,490
Retained Earnings (Deficit) 519,540 350,868
661,967 488,391
Less: Treasury Stock, at Average Cost (66,533) (65,691)
Total Shareholders’ Equity 595,434 422,700
Total Liabilities and Shareholders’ Equity $770,546 $589,577
The accompanying Notes are an integral part of these Consolidated Financial Statements.
C O N SO L I D AT ED B A L A N CE S H E E T S
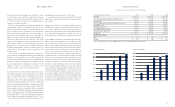
Shareholders’ Equity ($ in Millions)
1997 1998 1999 2000 2001
$59
$311
$423
$50
$100
$150
$200
$250
$300
$350
$400
$450
$500
$550
$600
Earnings Per Diluted Share
1997 1998 1999 2000 2001
$0.47
$0.20
$0.40
$0.60
$0.80
$1.00
$1.20
$1.40
$1.60
$1.80
$0.96
$1.39
$1.55
$1.65
$186
$595
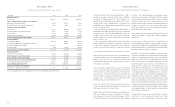
C O N SO L I D AT ED S TAT E M E N T S OF SH AREH OLDERS’ EQUITY
Common Stock
Treasury
Stock, Total
Shares Par Paid-In Retained at Average Shareholders’
(Thousands)Outstanding Value Capital Earnings Cost Equity
Balance, January 30,1999 102,814 $1,033 $143,626 $ 43,131)$ (1,685) $ 1 8 6,105
Purchase of Treasury Stock (1,510) – – – (50,856) (50,856)
Net Income – – – 149,604 – 149,604
Tax Benefit from Exercise of Stock
Options and Vesting of Restricted Stock – – 9,389 – – 9,389
Stock Options, Restricted Stock and Other 700 – (5,710) – 22,562 16,852
Balance, January 29,2000 102,004 $1,033 $147,305 $192,735 $(29,979) $311,094
Purchase of Treasury Stock (3,550) – – – (43,929) (43,929)
Net Income – – – 158,133 – 158,133
Tax Benefit from Exercise of Stock
Options and Vesting of Restricted Stock – – 462 – – 462
Stock Options, Restricted Stock and Other 342 – (11,277) – 8,217 (3,060)
Balance, February 3, 2001 98,796 $1,033 $136,490 $350,868 $(65,691) $422,700
Purchase of Treasury Stock (600) – – – (11,069) (11,069)
Net Income – – – 168,672 – 168,672
Tax Benefit from Exercise of Stock
Options and Vesting of Restricted Stock – – 5,056 – – 5,056
Stock Options, Restricted Stock and Other 677 – (152) – 10,227 10,075
Balance, February 2, 2002 98,873 $1,033 $141,394 $519,540 $(66,533) $595,434
The accompanying Notes are an integral part of these Consolidated Financial Statements.