Abercrombie & Fitch 2001 Annual Report Download - page 7
Download and view the complete annual report
Please find page 7 of the 2001 Abercrombie & Fitch annual report below. You can navigate through the pages in the report by either clicking on the pages listed below, or by using the keyword search tool below to find specific information within the annual report.-
 1
1 -
 2
2 -
 3
3 -
 4
4 -
 5
5 -
 6
6 -
 7
7 -
 8
8 -
 9
9 -
 10
10 -
 11
11 -
 12
12 -
 13
13 -
 14
14 -
 15
15 -
 16
16 -
 17
17 -
 18
18
 |
 |

C o m p a n y’s Web sites accounted for 4.5% of net sales in the
fourth quarter of 2001 as compared to 5.0% in 2000. The decrease
is primarily due to the Company not producing an A&F Quarterly
in the fourth quarter of 2001.
Fourth quarter 2000 net sales increased 21% to $439.4 million
from $363.7 million in 1999. The increase was due to the addi-
tion of new stores offset by a 9% decline in comparable store
sales. The addition of new and noncomparable store sales resulted
in an addition to net sales of $98.4 million. The decline in com-
parable store sales, based on a 14 week quarter for both 2000 and
1999, totaled $30.9 million and was primarily due to comparable
store sales decreases in the men’s graphic tees and pants depart-
ments due to the difficulty in anniversarying paratroop pants.
Comparable store sales were positive in the women’s business for
the quarter based on strong increases in the sweaters, denim and
o u t e rwear departments. The Company’s catalogue, the A&F
Quarterly and the Company’s Web sites accounted for 5.0% of net
sales in the fourth quarter of 2000 as compared to 3.8% in 1999.
Net sales for the 2001 fiscal year increased 10% to $1.36 billion
from $1.24 billion in 2000. The sales increase was attributable to
the net addition of 137 stores offset by a 9% comparable store sales
decrease. The addition of new and noncomparable store sales
resulted in an addition to net sales of $215.4 million. The decline
in comparable store sales, as compared with last year’s 52 week
period ended February 3, 2001, amounted to $98.9 million and
was mostly due to continued weakness in the men’s business.
Men’s comparable store sales decreased in the high-teens for the
year; however, denim, knits and gymwear performed well.
Comparable store sales were up in the mid-single digits in the
women’s business for the year. The strongest performing cate-
gories were in denim, knits, skirts, gymwear and women’s
accessories. Overall, the women’s business has increased to
become a larger percentage of the overall business and the trend
is expected to continue. In fiscal 2001, the women’s business
accounted for 55% of the total adult business. The kids’ business
had a mid-teen decline in comparable store sales for the year with
girls’ performing better than boys’. The Company’s catalogue, the
A&F Quarterly and the Company’s Web sites represented 4.2% of
2001 net sales compared to 3.8% last year. Operating improvements
in e-commerce fulfillment helped reduce the number of back-
o r d e r s , increasing sales by improving in-stocks. The Company
produced only three A&F Quarterly’s in fiscal 2001 versus four in
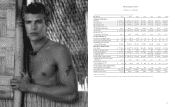
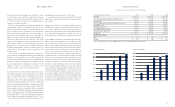
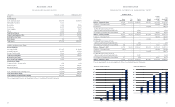
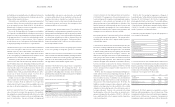
FINANCIAL SUMMARY The following summarized financial
data compares the 2001 fiscal year to the comparable periods
for 2000 and 1999:
% Change
2001- 2000-
2001 2000 1999 2000 1999
Net sales (millions) $1,364.9 $1,237.6 $1,030.9 10% 20%
Increase (decrease) in comparable
store sales (9%) (7%) 10%
Retail sales increase attributable
to new and remodeled stores,
magazine, catalogue and Web sites 19% 27% 18%
Retail sales per average
gross square foot $0,401 $0,474 $0,505 (15%) (6%)
Retail sales per average store
(thousands) $3,095 $3,944 $4,487 (22%) (12%)
Average store size at year-end
(gross square feet) 7,480 8,047 8,695 (7%) (7%)
Gross square feet at year-end
(thousands) 3,673 2,849 2,174 29% 31%
Number of stores:
Beginning of year 354 250 196
Opened 138 104 54
Closed (1))– –
End of year 491 354 250
NET SALES Fourth quarter 2001 net sales increased 6% to $466.6
million from $439.4 million in 2000. The increase was due to the
addition of new stores offset by a 9% decline in comparable store
sales as compared with last year’s 13 week period ended Fe b ru a ry
3, 2001. The fourth quarter of 2001 was highly promotional and
a number of promotional strategies, including direct mail, bounce-
backs and selective price point reductions, were employed to
improve the sales trend from the previous quarter. Although total
Company comparable store sales remained negative, the addition
of new and noncomparable store sales resulted in an addition to net
sales of $63.6 million. The decrease in comparable store sales
amounted to a $35.6 million decrease in net sales and was primarily
due to continued weakness in the men’s business. Comparable store
sales were roughly flat in the women’s business for the quarter.
Stronger performing categories were in graphic knits, denim, skirts
and women’s accessories. Men’s comparable store sales decreased
in the mid-teens for the quarter; however, denim and knits per-
formed well. The kids’ business followed a similar trend to the adult
business with girls’ comparable store sales much stronger than
boys’. The adult e-commerce business continued to become a
larger part of the business as Internet sales grew by over 27% dur-
ing the fourth quarter compared to last year. The Company’ s
catalogue, the A&F Quarterly (a catalogue/magazine) and the
RESULTS OF OPERATIONS Net sales for the fourth quarter of
the 2001 fiscal year were $466.6 million, an increase of 6% from
$439.4 million for the fourth quarter a year ago. Operating
income was $128.6 million compared to $124.1 million last year.
A&F recorded its 38th consecutive quarter of record earnings as
net income increased to $79.2 million in the fourth quarter of 2001
as compared to $77.2 million last year. Earnings per diluted
share were $.78, up 3% from $.76 last year.
Net sales for the 2001 fiscal year increased 10% to $1.36 billion
from $1.24 billion last year. Operating income for the year
increased 7% to $271.5 million from $253.7 million in 2000.
Net income per diluted share was $1.65 compared to $1.55 a year
ago, an increase of 6%.
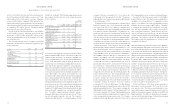
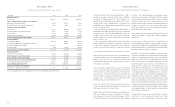
The following data represents the Company’s consolidated
statements of income for the last 3 fiscal years expressed as a per-
centage of net sales:
2001 2000 1999
Net Sales 100.0% 100.0% 100.0%
Cost of Goods Sold, Occupancy
and Buying Costs 59.1 58.8 56.3
Gross Income 40.9 41.2 43.7
General, Ad m i n i s t r a t i v e
and Store Operating Expenses 21.0 20.7 20.2
Operating Income 19.9 20.5 23.5
Interest Income, Net (0.4) (0.6) (0.7)
Income Before Income Taxes 20.3 21.1 24.2
Provision for Income Ta x e s 7.9 8.3 9.7
Net Income 12.4 12.8 14.5
13
Ab e rcr ombi e &Fitch
12
M A N AGEMENT’S DISC U SSION AND ANALY S I S
Ab e r cr omb i e&Fitch
2000, dampening the increase over last year in the direct business.
Net sales for the 2000 fiscal year increased 20% to $1.24 billion
from $1.03 billion in 1999. The sales increase was attributable to
the addition of 104 stores offset by a 7% comparable store sales
decrease. The addition of new and noncomparable store sales
resulted in an increase to net sales of $255.4 million. The decline
in comparable store sales, based on a 53 week fiscal year for both
2000 and 1999, totaled $64.9 million and was across both the
men’s and women’s businesses. During the year, the assort-
ment in each business was repositioned to be more balanced
and less focused on graphics and included items at key opening
price points. The Company’s catalogue, the A&F Quarterly and
the Company’s Web sites represented 3.8% of 2000 net sales
compared to 2.9% last year.
G R O SS INCOME The gross income rate (gross income divided by
net sales) during the fourth quarter of 2001 was 44.7%, down from
46.2% for the same period in 2000. The decrease was primarily due
to an increase in the markdown rate, attributable to the expected
higher level of promotional business. T he planned promotional
strategies for the quarter resulted in selling at lower average retail
prices. For the quarter, average unit retail prices decreased in the
low-double digits. Ad d i t i o n a l l y, buying and occupancy costs,
expressed as a percentage of net sales, increased as a result of the
inability to leverage fixed expenses with lower sales volume per
average store. These decreases were partially offset by higher
initial markup (IMU) and tight control of inventory. The increase
in IMU was a result of continued improvement in the sourcing of
merchandise, particularly in the women’s business. The tight con-
trol of inventory resulted in inventories being down 30% per
gross square foot at year-end as compared with last year. These
low levels of inventory provided downside profit protection as sea-
son-end merchandise was significantly lower on a per square
foot basis as compared to the same period in 2000.
For the fourth quarter of 2000, gross income, expressed as a
percentage of net sales, decreased to 46.2% from 50.9% for the
same period in 1999. T he decrease was attributable to lower
merchandise margins (representing gross income before the
deduction of buying and occupancy costs) due to lower IMU and
higher markdowns. The IMU was affected by both a change in
sales mix and the planned strategy of offering lower opening
price points in key product classifications.