ADT 2004 Annual Report Download - page 19
Download and view the complete annual report
Please find page 19 of the 2004 ADT annual report below. You can navigate through the pages in the report by either clicking on the pages listed below, or by using the keyword search tool below to find specific information within the annual report.-
 1
1 -
2
-
3
-
4
-
5
-
6
-
7
-
8
-
 9
9 -
 10
10 -
 11
11 -
 12
12 -
 13
13 -
 14
14 -
 15
15 -
 16
16 -
 17
17 -
 18
18 -
 19
19 -
 20
20 -
 21
21 -
 22
22 -
 23
23 -
 24
24 -
 25
25 -
 26
26 -
 27
27 -
 28
28 -
 29
29 -
30
-
31
-
32
-
33
-
34
-
35
-
36
-
37
-
38
-
39
-
40
-
41
-
42
-
43
-
44
-
45
-
46
-
47
-
48
-
49
-
50
-
51
-
52
 |
 |

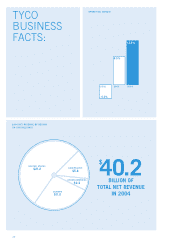
17
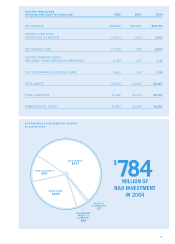
TOTAL NET REVENUE
(IN US$ BILLIONS)
2002
$34.8
2003 2004
$40.2
$36.0
2004 NET REVENUE BY SEGMENT
(IN US$ BILLIONS)
TOTAL = $40.2
HEALTHCARE
$9.1 ELECTRONICS
$11.8
FIRE &
SECURITY
$11.5
ENGINEERED
PRODUCTS
& SERVICES
$6.0
PLASTICS
& ADHESIVES
$1.8
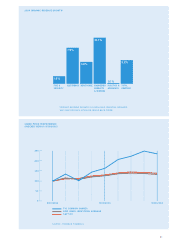
FREE CASH FLOW*
(IN US$ MILLIONS)
* FREE CASH FLOW IS A NON-GAAP FINANCIAL MEASURE.
SEE GAAP RECONCILIATION ON INSIDE BACK COVER.
2002
$793
2003 2004
$3,184
$4,837
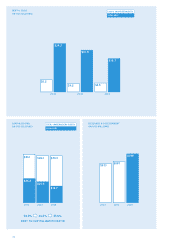
DILUTED EARNINGS (LOSS) PER SHARE
FROM CONTINUING OPERATIONS
2002
$(1.43)
2003 2004
$1.41
$0.52