3M 2006 Annual Report Download - page 56
Download and view the complete annual report
Please find page 56 of the 2006 3M annual report below. You can navigate through the pages in the report by either clicking on the pages listed below, or by using the keyword search tool below to find specific information within the annual report.-
 1
1 -
2
-
3
-
4
-
5
-
6
-
7
-
8
-
9
-
10
-
11
-
12
-
13
-
14
-
15
-
16
-
17
-
18
-
19
-
20
-
21
-
22
-
23
-
24
-
25
-
26
-
27
-
28
-
29
-
30
-
31
-
32
-
33
-
34
-
35
-
36
-
37
-
38
-
39
-
40
-
41
-
42
-
43
-
44
-
45
-
 46
46 -
 47
47 -
 48
48 -
 49
49 -
 50
50 -
 51
51 -
 52
52 -
 53
53 -
 54
54 -
 55
55 -
 56
56 -
 57
57 -
 58
58 -
 59
59 -
 60
60 -
 61
61 -
 62
62 -
 63
63 -
 64
64 -
 65
65 -
 66
66 -
67
-
68
-
69
-
70
-
71
-
72
-
73
-
74
-
75
-
76
-
77
-
78
-
79
-
80
-
81
-
82
-
83
-
84
-
85
-
86
-
87
-
88
-
89
-
90
-
91
-
92
-
93
-
94
-
95
-
96
-
97
-
98
-
99
-
100
-
101
-
102
-
103
-
104
-
105
-
106
-
107
-
108
-
109
-
110
-
111
-
112
-
113
-
114
-
115
-
116
 |
 |

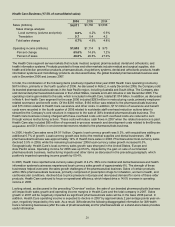
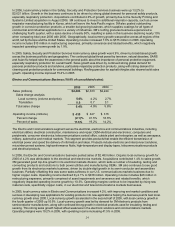
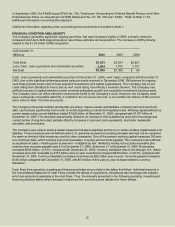
Investments in property, plant and equipment enable growth in diverse markets, helping to meet product demand and
increasing manufacturing efficiency. Capital expenditures were $1.168 billion in 2006, an increase of $225 million
compared with 2005, as 3M invested in a number of growing and highly profitable businesses such as medical,
respiratory protection, LCD films and others. The Company expects capital expenditures to total approximately
ELOOLRQWRELOOLRQLQ5HIHUWRWKHSUHFHGLQJ³&DSLWDO6SHQGLQJ1HW3URSHUW\3ODQWDQG(TXLSPHQW´VHFWLRQ
for more detail.
Refer to Note 2 for information on 2006, 2005 and 2004 acquisitions. Note 2 also provides information on the
proceeds from the sale of the pharmaceuticals business. The Company is actively considering additional acquisitions,
investments and strategic alliances, and from time to time may also divest certain businesses.
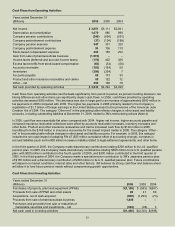
Purchases of marketable securities and investments and proceeds from sale (or maturities) of marketable securities and
investments in 2006 and 2005 are primarily attributable to auction rate and asset-backed securities, which are classified
as available-for-sale. 2006 includes purchases, net of sales and maturities, of $637 million for marketable securities. Prior
to 2005, purchases of and proceeds from the sale of auction rate securities were classified as Cash and Cash
Equivalents. At December 31, 2004, the amount of such securities taken as a whole was immaterial to Cash and Cash
Equivalents, and accordingly was not reclassified for 2004 and prior. Purchases of investments in 2005 include the
purchase of 19% of TI&M Beteiligungsgesellschaft mbH (discussed previously under the Industrial and Transportation
business segment). The purchase price of approximately $55 mLOOLRQLVUHSRUWHGDV³,QYHVWPHQWV´LQWKH&RQVROLGDWHG
%DODQFH6KHHWDQGDV³3XUFKDVHVRIPDUNHWDEOHVHFXULWLHVDQGLQYHVWPHQWV´LQWKH&RQVROLGDWHG6WDWHPHQWRI&DVK
Flows. Additional purchases of investments include additional survivor benefit insurance and equity investments.
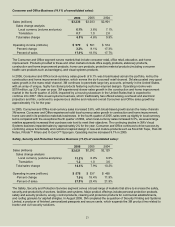
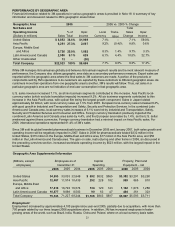
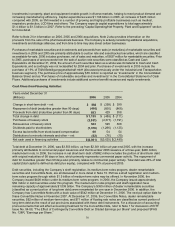
Cash Flows from Financing Activities:
Years ended December 31
(Millions) 2006 2005 2004
&KDQJHLQVKRUWWHUPGHEW±QHW $ 882 $ (258) $ 399
Repayment of debt (maturities greater than 90 days) (440) (656) (868)
Proceeds from debt (maturities greater than 90 days) 693 429 358
Total change in debt $ 1,135 $ (485) $ (111)
Purchases of treasury stock (2,351) (2,377) (1,791)
Reissuances of treasury stock 523 545 508
Dividends paid to stockholders (1,376) (1,286) (1,125)
Excess tax benefits from stock-based compensation 60 54 54
'LVWULEXWLRQVWRPLQRULW\LQWHUHVWVDQGRWKHU±QHW (52) (76) (15)
Net cash used in financing activities $(2,061) $(3,625) $(2,480)
Total debt at December 31, 2006, was $3.553 billion, up from $2.381 billion at year-end 2005, with the increase
primarily attributable to commercial paper issuances and the November 2006 issuance of a three-year, $400 million,
medium-term note. In 2006, the increase in net short-term debt of $882 million includes the portion of short-term debt
with original maturities of 90 days or less, which primarily represents commercial paper activity. The repayment of
debt for maturities greater than 90 days also primarily relates to commercial paper activity. Total debt was 26% of total
capital (total capital is defined as debt plus equity), compared with 19% at year-end 2005.
'HEWVHFXULWLHVLQFOXGLQJWKH&RPSDQ\¶VVKHOIUHJLVWUDtion, its medium-term notes program, dealer remarketable
securities and Convertible Note, are all discussed in more detail in Note 10. 3M has a shelf registration and medium-
term notes program through which $1.5 billion of medium-term notes may be offered. In November 2006, the
Company issued $400 million under its medium-term notes program. In 2004, the Company issued approximately
$62 million in debt securities under this program. The medium-term notes program and shelf registration have
remaining capacity of approximately $1.038 billion. The ComSDQ\¶VPLOOLRQRIGHDOHUUHPDUNHWDEOHVHFXULWLHV
(classified as current portion of long-term debt) were remarketed for one year in December 2006. In addition, the
Company has Convertible Notes with a book value of $542 million at December 31, 2006. The next put option date for
these Convertible Notes is November 2007. At December 31, 2006, the Convertible Notes, dealer remarketable
securities, $62 million of medium-term notes, and $71 million of floating rate notes are classified as current portion of
long-term debt as the result of put provisions associated with these debt instruments. For a discussion of accounting
pronouncements that will affect accounting treatment for the Convertible Note, refer to Note 1 for discussion of EITF
,VVXH1R³7KH(IIHFWRI&RQWingently Convertible Debt on Diluted (DUQLQJVSHU6KDUH´DQGSURSRVHG6)$6
1R5³(DUQLQJVSHU6KDUH´