3M 2006 Annual Report Download - page 26
Download and view the complete annual report
Please find page 26 of the 2006 3M annual report below. You can navigate through the pages in the report by either clicking on the pages listed below, or by using the keyword search tool below to find specific information within the annual report.-
 1
1 -
2
-
3
-
4
-
5
-
6
-
7
-
8
-
9
-
10
-
11
-
12
-
13
-
14
-
15
-
 16
16 -
 17
17 -
 18
18 -
 19
19 -
 20
20 -
 21
21 -
 22
22 -
 23
23 -
 24
24 -
 25
25 -
 26
26 -
 27
27 -
 28
28 -
 29
29 -
 30
30 -
 31
31 -
 32
32 -
 33
33 -
 34
34 -
 35
35 -
 36
36 -
37
-
38
-
39
-
40
-
41
-
42
-
43
-
44
-
45
-
46
-
47
-
48
-
49
-
50
-
51
-
52
-
53
-
54
-
55
-
56
-
57
-
58
-
59
-
60
-
61
-
62
-
63
-
64
-
65
-
66
-
67
-
68
-
69
-
70
-
71
-
72
-
73
-
74
-
75
-
76
-
77
-
78
-
79
-
80
-
81
-
82
-
83
-
84
-
85
-
86
-
87
-
88
-
89
-
90
-
91
-
92
-
93
-
94
-
95
-
96
-
97
-
98
-
99
-
100
-
101
-
102
-
103
-
104
-
105
-
106
-
107
-
108
-
109
-
110
-
111
-
112
-
113
-
114
-
115
-
116
 |
 |

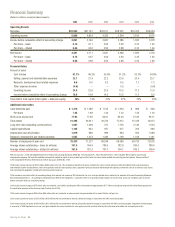
Financial Summary
(Dollars in millions, except per share amounts)
2006 2005 2004 2003 2002 2001
Operating Results
Net sales $22,923 $21,167 $20,011 $18,232 $16,332 $16,054
Operating income 5,696 4,854 4,326 3,504 2,816 2,075
Income before cumulative effect of accounting change 3,851 3,146 2,841 2,286 1,832 1,278
Per share – basic 5.15 4.11 3.64 2.92 2.35 1.62
Per share – diluted 5.06 4.03 3.56 2.88 2.32 1.60
Net income 3,851 3,111 2,841 2,286 1,832 1,278
Per share – basic 5.15 4.07 3.64 2.92 2.35 1.62
Per share – diluted 5.06 3.98 3.56 2.88 2.32 1.60
Financial Ratios
Percent of sales
Cost of sales 51.1% 49.2% 51.2% 52.3% 54.8%
Selling, general and administrative expenses 22.1 21.9 22.2 22.6 23.4 25.7
Research, development and related expenses 6.6 6.0 6.2 6.5 7.1 7.2
Other expense (income) (4.6) – – 0.5 – (0.6)
Operating income 24.8 22.9 21.6 19.2 17.2 12.9
Income before cumulative effect of accounting change 16.8 14.9 14.2 12.5 11.2 8.0
Total debt to total capital (total capital = debt plus equity) 26% 19% 21% 27% 35% 32%
Additional Information
Cash dividends paid $ 1,376 $ 1,286 $ 1,125 $ 1,034 $ 968 $ 948
Per share 1.84 1.68 1.44 1.32 1.24 1.20
Stock price at year-end 77.93 77.50 82.07 85.03 61.65 59.11
Total assets 21,294 20,541 20,723 17,612 15,339 14,613
Long-term debt (excluding current portion) 1,047 1,309 727 1,735 2,140 1,520
Capital expenditures 1,168 943 937 677 763 980
Depreciation and amortization 1,079 986 999 964 954 1,089
Research, development and related expenses 1,522 1,274 1,246 1,190 1,158 1,161
Number of employees at year-end 75,333 71,227 68,244 68,089 69,720 72,628
Average shares outstanding – basic (in millions) 747.5 764.9 780.5 782.8 780.0 788.6
Average shares outstanding – diluted (in millions) 761.0 781.3 797.3 794.1 789.2 799.6
Effective January 1, 2006, 3M adopted Statement of Financial Accounting Standards (SFAS) No. 123 (revised 2004), “Share-Based Payment,” which required 3M to expense stock-based
compensation expense. 3M used the modified retrospective method to adjust all prior periods to give effect to the fair-value based method of accounting for stock options. Please see Note 1
to the Consolidated Financial Statements for further discussion of SFAS No. 123R.
2006 results include net gains of $523 million ($438 million after tax). This included net benefits from gains related to the sale of certain portions of 3M’s branded pharmaceuticals business
and favorable income tax adjustments, which were partially offset by restructuring actions, acquired in-process research and development expenses, settlement costs of an antitrust class action,
and environmental obligations related to the pharmaceuticals business.
2005 includes a cumulative effect of accounting change that reduced net income by $35 million after tax, or 4 cents per diluted share, related to the adoption of Financial Accounting Standards
Board Interpretation No. 47, “Accounting for Conditional Asset Retirement Obligations.” Cumulative effect of accounting change impacts net income only, and is not included as part of income
before cumulative effect of accounting change.
2005 results include charges of $75 million after tax related to a tax liability resulting from 3M’s reinvestment of approximately $1.7 billion of foreign earnings into the United States pursuant to
the repatriation provision of the American Jobs Creation Act of 2004.
2003 results include charges of $93 million ($58 million after tax), related to an adverse court ruling associated with a lawsuit filed by LePage’s Inc.
2002 results include net losses of $202 million ($108 million after tax and minority interest), related to charges in connection with 3M’s restructuring plan.
2001 results include net losses of $504 million ($312 million after tax and minority interest), principally related to charges in connection with 3M’s restructuring plan, acquisition-related charges,
a reversal of a 1999 litigation accrual, and a net gain related to the sale of available-for-sale equity securities, partially offset by the write-down of available-for-sale equity securities.
Working Our Magic 24
50.0%