3M 2006 Annual Report Download - page 42
Download and view the complete annual report
Please find page 42 of the 2006 3M annual report below. You can navigate through the pages in the report by either clicking on the pages listed below, or by using the keyword search tool below to find specific information within the annual report.-
 1
1 -
2
-
3
-
4
-
5
-
6
-
7
-
8
-
9
-
10
-
11
-
12
-
13
-
14
-
15
-
16
-
17
-
18
-
19
-
20
-
21
-
22
-
23
-
24
-
25
-
26
-
27
-
28
-
29
-
30
-
31
-
 32
32 -
 33
33 -
 34
34 -
 35
35 -
 36
36 -
 37
37 -
 38
38 -
 39
39 -
 40
40 -
 41
41 -
 42
42 -
 43
43 -
 44
44 -
 45
45 -
 46
46 -
 47
47 -
 48
48 -
 49
49 -
 50
50 -
 51
51 -
 52
52 -
53
-
54
-
55
-
56
-
57
-
58
-
59
-
60
-
61
-
62
-
63
-
64
-
65
-
66
-
67
-
68
-
69
-
70
-
71
-
72
-
73
-
74
-
75
-
76
-
77
-
78
-
79
-
80
-
81
-
82
-
83
-
84
-
85
-
86
-
87
-
88
-
89
-
90
-
91
-
92
-
93
-
94
-
95
-
96
-
97
-
98
-
99
-
100
-
101
-
102
-
103
-
104
-
105
-
106
-
107
-
108
-
109
-
110
-
111
-
112
-
113
-
114
-
115
-
116
 |
 |

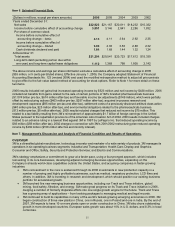
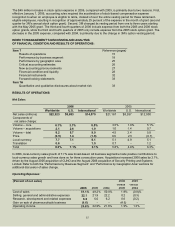
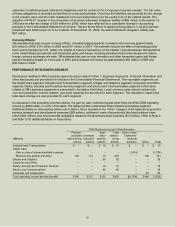
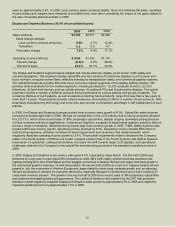
The dollar impact of stock-based compensation by major caption for the consolidated statement of income is provided in
Note 1. As discussed in the preceding overview section, the gain on sale, restructuring and other items benefited 2006
operating income by $523 million, or 2.2% of net sales. The following table summarizes these impacts by operating
expense category. Additional details on restructuring actions arHLQ1RWH,WHPVLQFOXGHGLQWKH³2WKHU´FDWHJRU\RIWKH
table are acquired in-process research and development expenses ($95 million), settlement costs of a previously
disclosed antitrust class action ($40 million), and environmental obligations related to the pharmaceuticals business
($13 million). Refer to Note 2 and Note 13 for additional details on these items.
5HVWUXFWXULQJDQG2WKHU6XPPDU\
Pharma-
FHXWLFDOV 2YHUKHDG %XVLQHVV
Total
restruc-
Gain on sale
of pharma-
(Millions) restructuring reduction specific turing ceuticals
DFWLRQV DFWLRQV DFWLRQV DFWLRQV EXVLQHVV 2WKHU 7RWDO
Cost of sales $ 32 $ 24 $ 74 $130 ± $ 13 $ 143
6HOOLQJJHQHUDODQGDGPLQLVWUDWLYHH[SHQVHV ±
5HVHDUFKGHYHORSPHQWDQGUHODWHGH[SHQVHV ± 75 ± 95 170
Gain on sale of pharmaceuticals business ± ± ± ± (1,074) ± (1,074)
Total operating income penalty (benefit) $166 $112 $125
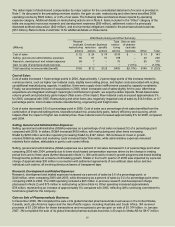
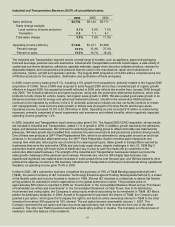
Cost of Sales:
Cost of sales increased 1.9 percentage points in 2006. Approximately 1.2 percentage points of this increase related to
numerous items, such as higher raw material costs, slightly lower selling prices, and higher costs associated with scaling
up additional manufacturing capacity. In addition, there were supply chain inefficiencies caused by capacity-constraints.
Finally, we accelerated the pace of acquisitions in 2006, which increased cost of sales slightly for the year. After these
acquisitions are integrated and begin meaningful contributions to growth, we H[SHFWSRVLWLYHLPSDFWV%URDGEDVHGVDOHV
volume growth and productivity gains helped offset some of this impact. Raw material costs increased approximately 3%
for 2006, compared with 2005. Restructuring and other items also negatively impacted cost of sales by $143 million, or 0.7
percentage points. Cost of sales includes manufacturing, engineering and freight costs.
&RVWRIVDOHVGHFUHDVHGRIDSHUFHQWage point in 2005. Cost of sales as a percentage of net sales benefited from the
combination of improved selling prices, favorable product mix, productivity gains, factory efficiency and sourcing, which
helped offset the impact of higher raw material prices. Raw material costs increased approximately 6% for 2005, compared
with 2004.
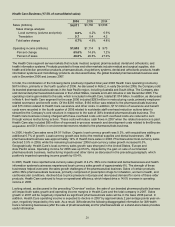
Selling, General and Administrative Expenses:
6HOOLQJJHQHUDODQGDGPLQLVWUDWLYH6*$ expenses as a percentage of net sales increased 0.2 of a percentage point
RULHQWHG6*$DVVDOHVDQGPDUNHWLQJFRVWVLQFUHDVHGIDVWer than sales, while administrative expenses remained
relatively flat in dollars, attributable in part to cost-control efforts.
6HOOLQJJHQHUDODQGDGPLQLVWUDWLYH6*$expenses as a percent of net sales decreased 0.3 of a percentage point when
comparing 2005 with 2004, primarily due to lower stock-based compensation expense driven by the change in vesting
period from one to three years (further discussed in Note 1). 3M continued to invest in growth programs and brand building
throughout the portfolio as a means of stLPXODWLQJJURZWK6*$LQWKHIRXUWKquarter of 2005 was impacted by a pre-tax
charge of approximately $30 million in connection with settlement agreements of one antitrust class action and two
individual such actions, all involving direct purchasers of transparent tape.
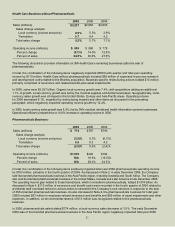
Research, Development and Related Expenses:
Research, development and related expenses increased as a percent of sales by 0.6 of a percentage point, or
PLOOLRQZKHQFRPSDULQJZLWKZKLOHGHFUHDVLQJDVa percent of sales by 0.2 of a percentage point when
comparing 2005 to 2004. The 2006 spending included a $95 million in-process research and development charge
(discussed in Note 2) and $75 million in restructuring DFWLRQV1RWH2WKHUVSHQGLQJLQFUHDVHGDSSUR[LPDWHO\
PLOOLRQUHSUHVHQWLQJDQLQFUHDVHRIDSSUR[LPDWHO\FRPSDUHGZLWKUHIOHFWLQJ0¶VFRQWLQXLQJFRPPLWPHQWWR
fund future growth for the Company.
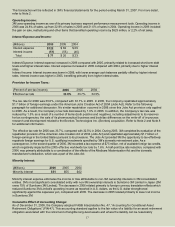
Gain on Sale of Pharmaceuticals Business:
In December 2006, 3M completed the sale of its globalEUDQGHGSKDUPDFHXWLFDOVEXVLQHVVHVLQWKH8QLWHG6WDWHV
Canada, and Latin America region and the Asia Pacific regiRQLQFOXGLQJ$XVWUDOLDDQG6RXWK$IULFD0UHFHLYHG
proceeds of $1.209 billion for these transactions and recognized a pre-tax gain on sale of $1.074 billion. In January
2007, 3M completed the sale of its global branded pharmacHXWLFDOVEXVLQHVVLQ(XURSHWR0HGD$%IRUPLOOLRQ
FRPSDUHGZLWK,QGROODUV6*$LQFUHDVHGPLOOLRQZLWKUHVWUXFWXULQJDQGRWKHULWHPVLQFUHDVLQJ
6*$E\PLOOLRQDQGRWKHUVSHQGLQJLQFUHDVLQJ6*$by $197 million. 3M continues to invest in growth-