3M 2006 Annual Report Download - page 37
Download and view the complete annual report
Please find page 37 of the 2006 3M annual report below. You can navigate through the pages in the report by either clicking on the pages listed below, or by using the keyword search tool below to find specific information within the annual report.-
 1
1 -
2
-
3
-
4
-
5
-
6
-
7
-
8
-
9
-
10
-
11
-
12
-
13
-
14
-
15
-
16
-
17
-
18
-
19
-
20
-
21
-
22
-
23
-
24
-
25
-
26
-
 27
27 -
 28
28 -
 29
29 -
 30
30 -
 31
31 -
 32
32 -
 33
33 -
 34
34 -
 35
35 -
 36
36 -
 37
37 -
 38
38 -
 39
39 -
 40
40 -
 41
41 -
 42
42 -
 43
43 -
 44
44 -
 45
45 -
 46
46 -
 47
47 -
48
-
49
-
50
-
51
-
52
-
53
-
54
-
55
-
56
-
57
-
58
-
59
-
60
-
61
-
62
-
63
-
64
-
65
-
66
-
67
-
68
-
69
-
70
-
71
-
72
-
73
-
74
-
75
-
76
-
77
-
78
-
79
-
80
-
81
-
82
-
83
-
84
-
85
-
86
-
87
-
88
-
89
-
90
-
91
-
92
-
93
-
94
-
95
-
96
-
97
-
98
-
99
-
100
-
101
-
102
-
103
-
104
-
105
-
106
-
107
-
108
-
109
-
110
-
111
-
112
-
113
-
114
-
115
-
116
 |
 |

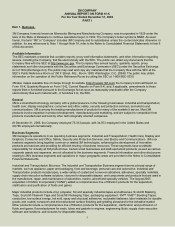
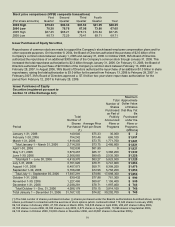
Item 6. Selected Financial Data.
(Dollars in millions, except per share amounts) 2006 2005 2004 2003 2002
Years ended December 31:
Net sales $22,923 $21,167 $20,011 $18,232 $16,332
Income before cumulative effect of accounting change 3,851 3,146 2,841 2,286 1,832
Per share of common stock:
Income before cumulative effect of
DFFRXQWLQJFKDQJH±EDVLF 5.15 4.11 3.64 2.92 2.35
Income before cumulative effect of
DFFRXQWLQJFKDQJH±GLOXWHG 5.06 4.03 3.56 2.88 2.32
Cash dividends declared and paid 1.84 1.68 1.44 1.32 1.24
At December 31:
Total assets $21,294 $20,541 $20,723 $17,612 $15,339
Long-term debt (excluding portion due within
one year) and long-term capital lease obligations 1,112 1,368 798 1,805 2,142
The above income and earnings per share information exclude a cumulative effect of accounting change in 2005
($35 million, or 5 cents per diluted share). Effective January 1, 2006, the Company adopted Statement of Financial
Accounting Standards No. 123 (revised 2004) and used the modified retrospective method to adjust all prior periods
to give effect to the fair-value based method of accounting for stock options. Refer to Note 1 for more detail on these
two items.
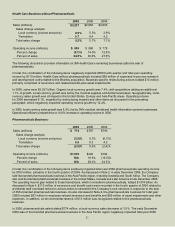
2006 results included net gains that increased operating income by $523 million and net income by $438 million. 2006
LQFOXGHGQHWEHQHILWVIURPJDLQVUHODWHGWRWKHVDOHRIFHUWDLQSRUWLRQVRI0¶VEUanded pharmaceuticals business
($1.074 billion pre-tax, $674 million after-tax) and favorable income tax adjustments ($149 million), which were partially
offset by restructuring actions ($403 million pre-tax, $257 million after-tax), acquired in-process research and
development expenses ($95 million pre-tax and after-tax), settlement costs of a previously disclosed antitrust class action
($40 million pre-tax, $25 million after-tax), and environmental obligations related to the pharmaceuticals business
($13 million pre-tax, $8 million after-tax). 2005 results included charges that reduced net income by $75 million. This
UHODWHGWRDWD[OLDELOLW\UHVXOWLQJIURP0¶VUHLQYHVWPHQWof approximately $1.7 billion of foreign earnings in the United
States pursuant to the repatriation provisions of the American Jobs Creation Act of 2004. 2003 results included charges
related to an adverse ruling in a lawsuit fLOHGDJDLQVW0LQE\/H3DJH¶V,QFWKDWUeduced operating income by
$93 million ($58 million after tax). 2002 charges in connection ZLWK0¶VUHVWUXFWXULQJSODQUHGXFHGRSHUDWLQJ
income by $202 million ($108 million after tax and minority interest).
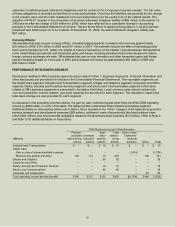
,WHP0DQDJHPHQW¶V'LVFXVVLRQDQG$QDO\VLVRI)LQDQFLDO&RQGLWLRQDQG5HVXOWVRI2SHUDWLRQV
29(59,(:
3M is a diversified global manufacturer, technology innovator and marketer of a wide variety of products. 3M manages its
operations in six operating business segments: Industrial and Transportation; Health Care; Display and Graphics;
Consumer and Office; Safety, Security and Protection Services; and Electro and Communications.
0¶VVWUDWHJ\HPSKDVL]HVDFRPPLWPHQWWRJURZDWDfaster pace, using a four-pronged approach, which includes
reinvesting in its core businesses, developing adjacent emerging business opportunities, expanding on the
&RPSDQ\¶VDOUHDG\ZRUOGFODVVFDSDEilities outside the United States, and acquiring companies in faster-growing
industries.
0¶VUHLQYHVWPHQWLQWKHFRUHLVHYLGHQFHGWKUough its 2006 investments in new production capacity in a
number of growing and highly profitable businesses, such as medical, respiratory protection, LCD films and
others. In addition, 3M is investing in research and development, which should position our existing business
portfolio for accelerated growth.
3M launched five new emerging business opportunities, including our Track and Trace initiative, global
mining, food safety, filtration, and energy. 3M made great progress on its Track and Trace initiative in 2006,
merging a number of formerly disparate efforts into one single growth engine for the future. Track and Trace
KDVDJURZLQJDUUD\RIDSSOLFDWLRQV±IURPWUDFNLng packages to managing medical and legal records.
3M continued to build its capabilities in many of the ZRUOG¶VIDVWHVWJURZLQJHPHUJLQJHFRQRPLHVLQ0
began construction of three new plants in China, one in Russia, one in Poland and one in India. By the end of
2007, 3M expects to have 10 or more plants open or under construction in China. 3M also drove outstanding
growth in more developed countries. European sales growth was about 10% in U.S. dollars, and 8.3% in local
currencies.