3M 2006 Annual Report Download - page 51
Download and view the complete annual report
Please find page 51 of the 2006 3M annual report below. You can navigate through the pages in the report by either clicking on the pages listed below, or by using the keyword search tool below to find specific information within the annual report.-
 1
1 -
2
-
3
-
4
-
5
-
6
-
7
-
8
-
9
-
10
-
11
-
12
-
13
-
14
-
15
-
16
-
17
-
18
-
19
-
20
-
21
-
22
-
23
-
24
-
25
-
26
-
27
-
28
-
29
-
30
-
31
-
32
-
33
-
34
-
35
-
36
-
37
-
38
-
39
-
40
-
 41
41 -
 42
42 -
 43
43 -
 44
44 -
 45
45 -
 46
46 -
 47
47 -
 48
48 -
 49
49 -
 50
50 -
 51
51 -
 52
52 -
 53
53 -
 54
54 -
 55
55 -
 56
56 -
 57
57 -
 58
58 -
 59
59 -
 60
60 -
 61
61 -
62
-
63
-
64
-
65
-
66
-
67
-
68
-
69
-
70
-
71
-
72
-
73
-
74
-
75
-
76
-
77
-
78
-
79
-
80
-
81
-
82
-
83
-
84
-
85
-
86
-
87
-
88
-
89
-
90
-
91
-
92
-
93
-
94
-
95
-
96
-
97
-
98
-
99
-
100
-
101
-
102
-
103
-
104
-
105
-
106
-
107
-
108
-
109
-
110
-
111
-
112
-
113
-
114
-
115
-
116
 |
 |

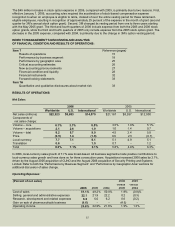
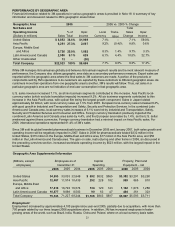
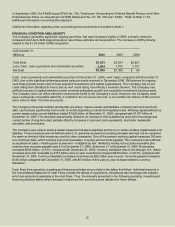
PERFORMANCE BY GEOGRAPHIC AREA
Financial information related to 3M operations in various geographic areas is provided in Note 18. A summary of key
LQIRUPDWLRQDQGGLVFXVVLRQUHODWHGWR0¶VJHRJUDSKLFDUHDVIROORZ
Geographic Area 2006 2006 vs. 2005 % Change
Net Sales and Total
Operating Income % o
f
Oper. Local Trans- Sales Oper.
(Dollars in millions) Sales Total Income Currency lation Change Income
United States $ 8,853 38.6% $1,908 ±
Asia Pacific 6,251 27.3% 2,097
Europe, Middle East
and Africa 5,726 25.0% 1,092
Latin America and Canada 2,080 9.1% 629
Other Unallocated 13 ± (30)
Total Company $22,923 100% $5,696 7.7% 0.6% 8.3% 17.3%
While 3M manages its businesses globally and believes its business segment results are the most relevant measure of
performance, the Company also utilizes geographic area data as a secondary performance measure. Export sales are
UHSRUWHGZLWKLQWKHJHRJUDSKLFDUHDZKHUHWKHILQDOVDOHVWR 3M customers are made. A portion of the products or
FRPSRQHQWVVROGE\0¶VRSHUDWLRQVWRLWVFXVWRPHUVDUHH[ported by these customers to different geographic areas. As
customers move their operations from one geographic area to DQRWKHU0¶VUHVXOWVZLOOIROORZ7KXVQHWVDOHVLQD
particular geographic area are not indicative of end-user consumption in that geographic area.
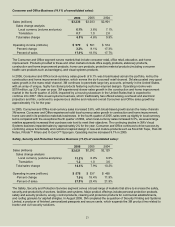
U.S. sales revenue increased 7.1%, as all six business segments contributed to this increase. Asia Pacific local-
FXUUHQF\VDOHVZKLFKH[FOXGHWUDQVODWLRQLPSDFWVLQFUHDVHG$OOVL[EXVLQHVVVHJPHQWVFRQWULEXWHGWRWKLV
LQFUHDVHLQWKH$VLD3DFLILFDUHDZLWKRSWLFDOILOPEHLQJWKHODUJHVWJURZWKFRPSRQHQW6DOHVLQ-DSDQWRWDOHG
DSSUR[LPDWHO\ELOOLRQZLWKORFDOFXUUHQF\VDOHVXSIURP(XUopean local-currency sales increased 8.3%,
ZLWKJRRGJURZWKLQ,QGXVWULDODQG7UDQVportation and Safety, Security and Protection Services. In the combined Latin
America and Canada area, local-currency sales increases of ZHUHOHGE\,QGXVWULDl and Transportation, Safety,
Security and Protection Services and Consumer and Office. Foreign currency translation positively impacted the
FRPELQHG/DWLQ$PHULFDDQG&DQDGDDUHDVDOHVE\DQGWKH(XURSHDQDUHDVDOHVE\DVWKH86GROODU
ZHDNHQHGDJDLQVWWKHVHFXUUHQFLHV)RUHign currency translation had a minimal impact on Asia Pacific sales. For
2006, international operations reprHVHQWHGRI0¶VVDOHV
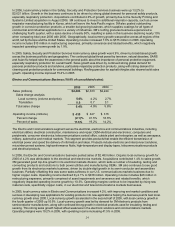
Since 3M sold its global branded pharmaceuticals busineVVLQ'HFHPEHUDQG-DQXDU\ERWKVDOHVJURZWKDQG
RSHUDWLQJLQFRPHZLOOEHQHJDWLYHO\LPSDFWHGLQ6DOHs in 2006 for pharmaceuticals totaled $332 million in the
United States, $315 million in the Europe, Middle East and Africa area, $77 million in the Asia Pacific area, and $50
million in the Latin America and Canada area. The gain on sale, restructuring and other items in 2006, as discussed in
WKHSUHFHGLQJRYHUYLHZVHFWLRQLQFUHDVHGZRUOGZLGHRSHUDWLQJLQFRPHE\PLOOLRQZLWKWKHODUJHVWLPSDFWLQWKH
United States.
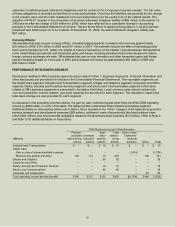
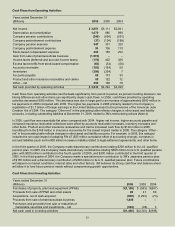
Geographic Area Supplemental Information
(Millions, except Employees as of Capital Property, Plant and
employees) December 31 Spending (TXLSPHQW±QHW
2006 2006 2006
United States 34,553 $ 692 $532 $565 $3,382
Asia Pacific 12,487 252 228 182 959 865 810
Europe, Middle East
and Africa 17,416 134 1,162 1,076 1,288
Latin America and Canada 10,877 90 404 361 323
Total Company 75,333 $1,168 $5,907
Employment:
Employment increased by approximately SHRSOHVLQFH\HDUHQGSDUWLDOO\GXHWRDFTXLVLWLRQVZLWKPRUHWKDQ
750 people added by our three largest 2006 acquisitions alone. In addition, 3M has increased employees in faster-
JURZLQJDUHDVRIWKHZRUOGVXFKDV%UD]LO,QGLD5XVVLD&KLQDDQG3RODQGZKHUHRQDORFDOFXUUHQF\EDVLVVDOHV