3M 2006 Annual Report Download - page 40
Download and view the complete annual report
Please find page 40 of the 2006 3M annual report below. You can navigate through the pages in the report by either clicking on the pages listed below, or by using the keyword search tool below to find specific information within the annual report.-
 1
1 -
2
-
3
-
4
-
5
-
6
-
7
-
8
-
9
-
10
-
11
-
12
-
13
-
14
-
15
-
16
-
17
-
18
-
19
-
20
-
21
-
22
-
23
-
24
-
25
-
26
-
27
-
28
-
29
-
 30
30 -
 31
31 -
 32
32 -
 33
33 -
 34
34 -
 35
35 -
 36
36 -
 37
37 -
 38
38 -
 39
39 -
 40
40 -
 41
41 -
 42
42 -
 43
43 -
 44
44 -
 45
45 -
 46
46 -
 47
47 -
 48
48 -
 49
49 -
 50
50 -
51
-
52
-
53
-
54
-
55
-
56
-
57
-
58
-
59
-
60
-
61
-
62
-
63
-
64
-
65
-
66
-
67
-
68
-
69
-
70
-
71
-
72
-
73
-
74
-
75
-
76
-
77
-
78
-
79
-
80
-
81
-
82
-
83
-
84
-
85
-
86
-
87
-
88
-
89
-
90
-
91
-
92
-
93
-
94
-
95
-
96
-
97
-
98
-
99
-
100
-
101
-
102
-
103
-
104
-
105
-
106
-
107
-
108
-
109
-
110
-
111
-
112
-
113
-
114
-
115
-
116
 |
 |

quantities of all raw materials to meet its reasonably foreseeable production requirements, but it is impossible to
predict future shortages of raw materials or the impact any such shortages would have. 3M manages commodity price
risks through negotiated supply contracts, price protection agreements and forward physical contracts. Fluctuations in
foreign currency exchange rates also impact results, although the Company minimizes this effect through hedging
about half of this impact. 3M continued, as it has for many years, to incur expenses (insured and uninsured) in
managing its litigation and environmental contingencies.
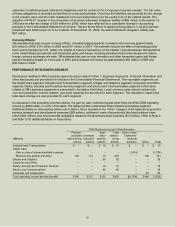
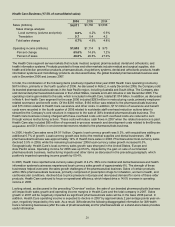
The sale of the pharmaceuticals business is not presented as a discontinued operation due to the extent of the
projected continuing cash flows from our contractual supply relationship with the buyers in relation to those of the
business that was sold. Therefore, it will create both a sales and profitability comparability issue beginning with first
quarter 2007 results. Annual sales in 2006 for pharmaceuticals were $774 million, and reported operating income was
$1.039 billion, including net gains of $783 million as discussHGLQWKH³3KDUPDFHXWLFDOV%XVLQHVV´GLVFXVVLRQWKDW
follows. Sales growth in 2007 will be negatively impacted as these pharmaceutical sales are in the base 2006 period.
0¶V'UXJ'HOLYHU\6\VWHPV'LYLVLRQZLOOEHDVRXUFHRI supply to the acquiring companies, with expected annual
revenues of approximately $100 million from the various arrangements with the three buyers. Such outsourcing
arrangements involve a lower profitability than the other product and service offerings of most of our existing Health
Care businesses.
3M restructured many areas in parallel with divesting the global branded pharmaceuticals business. The great
majority of those costs will not be eliminated until late in the first quarter or early in the second quarter of 2007.
Earnings growth is expected to be slowest in the first quarter of 2007 due to these continued expenses and the strong
comparable first quarter in 2006. 3M expects earnings to improve somewhat in the second quarter of 2007, and
accelerate more into the second half of the year.
%HJLQQLQJLQWKH&RPSDQ\LVPRGLI\LQJLWVORQJWHUPDQGVKRUWWHUPLQFHQWLYHFRPSHQVDWLRQSURJUDPVWRDOLJQ
employee and shareholder interests more closely. The ComSDQ\VVKRUWWHUPLQFHQWLYHcompensation plan is moving
DZD\IURPLWVTXDUWHUO\\HDURYHU\HDUIRFXVHGSURILW sharing plan toward an annual bonus plan with payouts tied
principally to performance measured by the operating plan. The Company is also reducing the number of traditional
VWRFNRSWLRQVJUDQWHGXQGHULWVORQJWHUPincentive compensation plan by reducing the number of employees eligible
to receive annual grants and by shifting a portion of the annual grant away from traditional stock options primarily to
restricted stock units. These changes will reduce the annual dilution impact from 1.5% of total outstanding common
stock to about 1%. However, associated with the reduction in the number of eligible employees, the Company decided
WRSURYLGHDRQHWLPH³EX\RXW´JUDQWWRWKHLPSDFWHGHPSOR\HHVZKLFKZLOOUHVXOWLQLQFUHDVHGVWRFNEDVHG
FRPSHQVDWLRQH[SHQVHLQ,QDGGLWLRQ0¶VFKDQJHLQWhe vesting period for stock options from one to three
years starting with the May 2005 grant also results LQKLJKHUH[SHQVHLQFRPSDUHGZLWK6WRFNEDVHG
compensation expense is expected to total $0.21 per diluted share in 2007, compared with $0.17 per diluted share in
2006.
7KHSUHFHGLQJIRUZDUGORRNLQJVWDWHPHQWVinvolve risks and uncertainties that could cause results to differ materially
IURPWKRVHSURMHFWHGUHIHUWRWKHIRUZDUGORRNLQJVWDWHPHQWs section in Item 7 and the risk factors provided in Item 1A
for discussion of these risks and uncertainties).
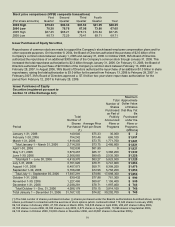
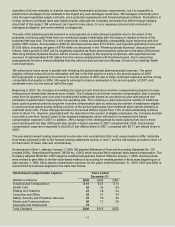
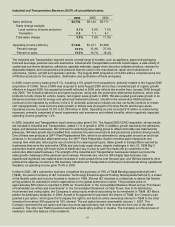
As discussed in Note 1, effective January 1, 2006, 3M adopted Statement of Financial Accounting Standards No. 123
UHYLVHG³6KDUH%DVHG3D\PHQW´6)$61R5ZKLFKUHTXLUHG0WRH[SHQVHVWRFNEDVHGFRPSHQVDWLRQ7KH
&RPSDQ\DGRSWHG6)$61R5XVLQJWKHPRGLILHGUHWURVSHFWLYH method. Effective January 1, 2006, all prior periods
ZHUHUHYLVHGWRJLYHHIIHFWWRWKHIDLUYDOXHEDVHGPHWKRGof accounting for awards granted in fiscal years beginning on or
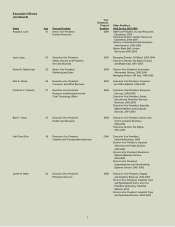
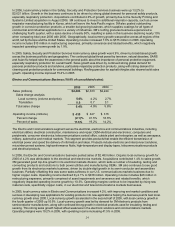
DIWHU-DQXDU\6WRFNEDVHGFRPpensation expense for the years ended 'HFHPEHUDQGLV
summarized by business segment in the table that follows.
Stock-based compensation expense
'ROODUVLQPLOOLRQV 2006
Industrial and Transportation $ 51
Health Care 42 58
'LVSOD\DQG*UDSKLFV 27 19 34
Consumer and Office 24 21 34
6DIHW\6HFXULW\DQG3URWHFWLRQ6HUYLFHV 21 16 26
Electro and Communications 20 17 26
Corporate and Unallocated 15 ±±
Total Company
2005 2004
$ 47
35
$200 $155 $252
$ 74
December 31
Years ended