3M 2005 Annual Report Download - page 98
Download and view the complete annual report
Please find page 98 of the 2005 3M annual report below. You can navigate through the pages in the report by either clicking on the pages listed below, or by using the keyword search tool below to find specific information within the annual report.-
 1
1 -
2
-
3
-
4
-
5
-
6
-
7
-
8
-
9
-
10
-
11
-
12
-
13
-
14
-
15
-
16
-
17
-
18
-
19
-
20
-
21
-
22
-
23
-
24
-
25
-
26
-
27
-
28
-
29
-
30
-
31
-
32
-
33
-
34
-
35
-
36
-
37
-
38
-
39
-
40
-
41
-
42
-
43
-
44
-
45
-
46
-
47
-
48
-
49
-
50
-
51
-
52
-
53
-
54
-
55
-
56
-
57
-
58
-
59
-
60
-
61
-
62
-
63
-
64
-
65
-
66
-
67
-
68
-
69
-
70
-
71
-
72
-
73
-
74
-
75
-
76
-
77
-
78
-
79
-
80
-
81
-
82
-
83
-
84
-
85
-
86
-
87
-
 88
88 -
 89
89 -
 90
90 -
 91
91 -
 92
92 -
 93
93 -
 94
94 -
 95
95 -
 96
96 -
 97
97 -
 98
98 -
 99
99 -
 100
100 -
 101
101 -
 102
102 -
 103
103 -
 104
104 -
 105
105 -
 106
106 -
 107
107 -
 108
108
 |
 |

72
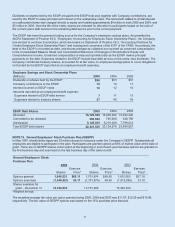
NOTE 14. Management Stock Ownership Program (MSOP)
In May 2005, shareholders approved 36.75 million shares for issuance under the MSOP in the form of management
stock options, restricted stock and stock appreciation rights. Under the plan, the Company has principally issued
management stock options that are granted at market value on the date of grant. Prior to 2005, under previous plans,
these options were generally exercisable one year after the date of grant, with expiration 10 years from the date of
grant. Effective with the May 2005 grant, the Company changed its vesting period from one to three years with the
expiration date remaining at 10 years from date of grant. Outstanding shares under option include grants from
previous plans. There were approximately 14,700 participants in the plan at December 31, 2005.
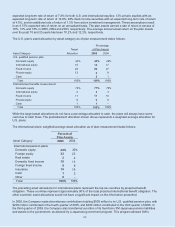
Management Stock Ownership Program
2005 2004 2003
Exercise Exercise Exercise
Shares Price* Shares Price* Shares Price*
Under option –
January 1 78,293,754 $58.70 73,629,275 $52.42 71,187,226 $48.78
Granted
Annual 11,391,723 76.87 12,499,425 84.39 12,571,075 61.91
Progressive (Reload) 751,995 81.19
892,425 83.10 1,048,236 66.86
Exercised (9,027,646) 48.30 (8,686,381) 44.81 (10,942,261) 41.26
Canceled (1,252,113) 75.65 (40,990) 79.85 (235,001) 39.29
December 31 80,157,713 $62.40 78,293,754 $58.70 73,629,275 $52.42
Options exercisable
December 31 68,714,166 $60.03 65,471,418 $53.91 60,663,659 $50.36
Shares available for grant
December 31 24,937,892 7,869,168 20,410,498
*Weighted average
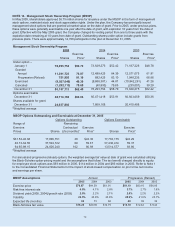
MSOP Options Outstanding and Exercisable at December 31, 2005
Options Outstanding Options Exercisable
Range of Remaining
Exercise Contractual Exercise Exercise
Prices Shares Life (months)* Price* Shares Price*
$31.52-46.68 17,806,751 30 $43.30 17,763,175 $43.29
46.73-64.50 37,524,722 69 59.37 37,436,414 59.37
64.65-89.15 24,826,240 102 80.69 13,514,577 83.86
*Weighted average
For annual and progressive (reload) options, the weighted average fair value at date of grant was calculated utilizing
the Black-Scholes option-pricing model and the assumptions that follow. The tax benefit charged directly to equity
for employee stock options was $93 million in 2005, $114 million in 2004 and $95 million in 2003. Refer to Note 1
to the Consolidated Financial Statements for the impact of stock-based compensation on pro forma net income
and earnings per share.
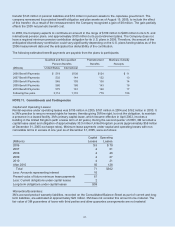
MSOP Assumptions Annual Progressive (Reload)
2005 2004 2003 2005 2004 2003
Exercise price $76.87 $84.39 $61.91 $81.19 $83.10 $66.86
Risk-free interest rate 4.0% 4.1% 2.6% 3.7% 2.7% 1.8%
Dividend yield (2005, 2004)/growth rate (2003) 2.0% 2.2% 2.1% 2.0% 2.2% 2.2%
Volatility 23.5% 23.8% 23.8% 20.9% 21.6% 23.7%
Expected life (months) 69 73 66 40 39 32
Black-Scholes fair value $18.28 $20.30 $12.75 $13.18 $12.42 $ 9.44