3M 2005 Annual Report Download - page 63
Download and view the complete annual report
Please find page 63 of the 2005 3M annual report below. You can navigate through the pages in the report by either clicking on the pages listed below, or by using the keyword search tool below to find specific information within the annual report.-
 1
1 -
2
-
3
-
4
-
5
-
6
-
7
-
8
-
9
-
10
-
11
-
12
-
13
-
14
-
15
-
16
-
17
-
18
-
19
-
20
-
21
-
22
-
23
-
24
-
25
-
26
-
27
-
28
-
29
-
30
-
31
-
32
-
33
-
34
-
35
-
36
-
37
-
38
-
39
-
40
-
41
-
42
-
43
-
44
-
45
-
46
-
47
-
48
-
49
-
50
-
51
-
52
-
 53
53 -
 54
54 -
 55
55 -
 56
56 -
 57
57 -
 58
58 -
 59
59 -
 60
60 -
 61
61 -
 62
62 -
 63
63 -
 64
64 -
 65
65 -
 66
66 -
 67
67 -
 68
68 -
 69
69 -
 70
70 -
 71
71 -
 72
72 -
 73
73 -
74
-
75
-
76
-
77
-
78
-
79
-
80
-
81
-
82
-
83
-
84
-
85
-
86
-
87
-
88
-
89
-
90
-
91
-
92
-
93
-
94
-
95
-
96
-
97
-
98
-
99
-
100
-
101
-
102
-
103
-
104
-
105
-
106
-
107
-
108
 |
 |

37
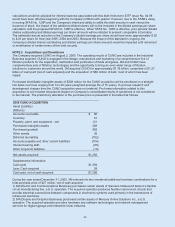
Consolidated Statement of Income
3M Company and Subsidiaries
Years ended December 31
(Millions, except per share amounts) 2005 2004 2003
Net sales $21,167 $20,011 $18,232
Operating expenses
Cost of sales 10,381 9,958 9,285
Selling, general and administrative expenses 4,535 4,281 3,994
Research, development and related expenses 1,242 1,194 1,147
Other expense – – 93
Total 16,158 15,433 14,519
Operating income 5,009 4,578 3,713
Interest expense and income
Interest expense 82 69 84
Interest income (56) (46) (28)
Total 26 23 56
Income before income taxes, minority interest and
cumulative effect of accounting change 4,983 4,555 3,657
Provision for income taxes 1,694 1,503 1,202
Minority interest 55 62 52
Income before cumulative effect of accounting change 3,234 2,990 2,403
Cumulative effect of accounting change (35) – –
Net income $ 3,199 $ 2,990 $ 2,403
Weighted average common shares outstanding – basic 764.9 780.5 782.8
Earnings per share – basic
Income before cumulative effect of accounting change $ 4.23 $ 3.83 $ 3.07
Cumulative effect of accounting change (0.05) – –
Net income $ 4.18 $ 3.83 $ 3.07
Weighted average common shares outstanding – diluted 776.9 796.5 795.3
Earnings per share – diluted
Income before cumulative effect of accounting change $ 4.16 $ 3.75 $ 3.02
Cumulative effect of accounting change (0.04) – –
Net income $ 4.12 $ 3.75 $ 3.02
The accompanying Notes to Consolidated Financial Statements are an integral part of this statement.