3M 2005 Annual Report Download - page 54
Download and view the complete annual report
Please find page 54 of the 2005 3M annual report below. You can navigate through the pages in the report by either clicking on the pages listed below, or by using the keyword search tool below to find specific information within the annual report.-
 1
1 -
2
-
3
-
4
-
5
-
6
-
7
-
8
-
9
-
10
-
11
-
12
-
13
-
14
-
15
-
16
-
17
-
18
-
19
-
20
-
21
-
22
-
23
-
24
-
25
-
26
-
27
-
28
-
29
-
30
-
31
-
32
-
33
-
34
-
35
-
36
-
37
-
38
-
39
-
40
-
41
-
42
-
43
-
 44
44 -
 45
45 -
 46
46 -
 47
47 -
 48
48 -
 49
49 -
 50
50 -
 51
51 -
 52
52 -
 53
53 -
 54
54 -
 55
55 -
 56
56 -
 57
57 -
 58
58 -
 59
59 -
 60
60 -
 61
61 -
 62
62 -
 63
63 -
 64
64 -
65
-
66
-
67
-
68
-
69
-
70
-
71
-
72
-
73
-
74
-
75
-
76
-
77
-
78
-
79
-
80
-
81
-
82
-
83
-
84
-
85
-
86
-
87
-
88
-
89
-
90
-
91
-
92
-
93
-
94
-
95
-
96
-
97
-
98
-
99
-
100
-
101
-
102
-
103
-
104
-
105
-
106
-
107
-
108
 |
 |

28
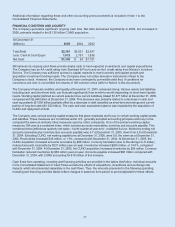
Cash Flows from Operating Activities:
Years ended December 31
(Millions) 2005 2004 2003
Net income $3,199 $2,990 $2,403
Depreciation and amortization 986 999 964
Company pension contributions (654) (591) (749)
Company postretirement contributions (134) (168) (194)
Company pension expense 331 325 168
Company postretirement expense 106 110 88
Income taxes (deferred and accrued income taxes) 417 396 539
Accounts receivable (184) 56 38
Inventories (294) 7 281
Accounts payable 113 35 62
Product and other insurance receivables and claims 122 12 (35)
Other – net 250 111 208
Net cash provided by operating activities $4,258 $4,282 $3,773
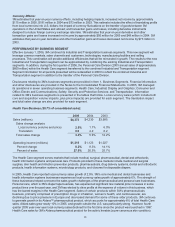
Cash flows from operating activities can fluctuate significantly from period to period, as pension funding decisions,
tax timing differences and other items can significantly impact cash flows. In 2005, cash flow was essentially flat
when compared to 2004. Higher net income, higher accounts payable and increased insurance receivable
collections were offset by accounts receivable increases, inventory increases and other items. Product and other
insurance receivables and claims increased cash flow by $122 million in 2005, benefiting from the $148 million in
insurance recoveries for the breast implant matter in 2005. For a more detailed discussion of these and other legal
proceedings, refer to Note 11 in the Consolidated Financial Statements of this Annual Report on Form 10-K. The
category “Other – net” in the preceding table reflects changes in other asset and liability accounts. For example, in
2005, this category includes the non-cash impact of adopting FIN 47 ($35 million cumulative effect of accounting
change), increases in accrued liabilities (such as the $30 million increase in liability related to legal settlement
agreements), and other items.
In 2005, the Company made discretionary contributions totaling $500 million to its U.S. qualified pension plan, with
$200 million contributed in the fourth quarter of 2005, and $300 million contributed in the third quarter of 2005. In
the third quarter of 2004, the Company made a special pension contribution to 3M’s Japanese pension plan of
$155 million and a discretionary contribution of $300 million to its U.S. qualified pension plan. In the third quarter of
2003, 3M made a discretionary contribution of $600 million to its U.S. qualified pension plan. Future contributions
will depend on market conditions, interest rates and other factors. 3M believes its strong cash flow and balance
sheet will allow it to fund future pension needs without compromising growth opportunities.
In 2004, cash flow improvements were primarily driven by higher net income. In all periods presented, significant
Company pension contributions negatively impacted cash flows. In all years, with a larger amount in 2003, a portion
of the tax timing benefit relates to the tax benefit received from Company pension contributions.
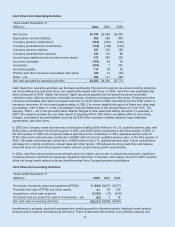
Cash Flows from Investing Activities:
Years ended December 31
(Millions) 2005 2004 2003
Purchases of property, plant and equipment (PP&E) $ (943) $(937) $(677)
Proceeds from sale of PP&E and other assets 41 69 129
Acquisitions, net of cash acquired (1,293) (73) (439)
Purchases and proceeds from sale of investments – net (46) 318
Net cash used in investing activities $(2,241) $(938) $(969)
Investments in property, plant and equipment are enabling growth in diverse markets, helping to meet product
demand and increasing manufacturing efficiency. These investments will continue to be primarily capacity and