eTrade 2012 Annual Report Download - page 5
Download and view the complete annual report
Please find page 5 of the 2012 eTrade annual report below. You can navigate through the pages in the report by either clicking on the pages listed below, or by using the keyword search tool below to find specific information within the annual report.-
 1
1 -
 2
2 -
 3
3 -
 4
4 -
 5
5 -
 6
6 -
 7
7 -
 8
8 -
 9
9 -
 10
10 -
 11
11 -
 12
12 -
 13
13 -
 14
14 -
 15
15 -
 16
16 -
17
-
18
-
19
-
20
-
21
-
22
-
23
-
24
-
25
-
26
-
27
-
28
-
29
-
30
-
31
-
32
-
33
-
34
-
35
-
36
-
37
-
38
-
39
-
40
-
41
-
42
-
43
-
44
-
45
-
46
-
47
-
48
-
49
-
50
-
51
-
52
-
53
-
54
-
55
-
56
-
57
-
58
-
59
-
60
-
61
-
62
-
63
-
64
-
65
-
66
-
67
-
68
-
69
-
70
-
71
-
72
-
73
-
74
-
75
-
76
-
77
-
78
-
79
-
80
-
81
-
82
-
83
-
84
-
85
-
86
-
87
-
88
-
89
-
90
-
91
-
92
-
93
-
94
-
95
-
96
-
97
-
98
-
99
-
100
-
101
-
102
-
103
-
104
-
105
-
106
-
107
-
108
-
109
-
110
-
111
-
112
-
113
-
114
-
115
-
116
-
117
-
118
-
119
-
120
-
121
-
122
-
123
-
124
-
125
-
126
-
127
-
128
-
129
-
130
-
131
-
132
-
133
-
134
-
135
-
136
-
137
-
138
-
139
-
140
-
141
-
142
-
143
-
144
-
145
-
146
-
147
-
148
-
149
-
150
-
151
-
152
-
153
-
154
-
155
-
156
-
157
-
158
-
159
-
160
-
161
-
162
-
163
-
164
-
165
-
166
-
167
-
168
-
169
-
170
-
171
-
172
-
173
-
174
-
175
-
176
-
177
-
178
-
179
-
180
-
181
-
182
-
183
-
184
-
185
-
186
-
187
-
188
-
189
-
190
-
191
-
192
-
193
-
194
-
195
-
196
-
197
-
198
-
199
-
200
-
201
-
202
-
203
-
204
-
205
-
206
-
207
-
208
-
209
-
210
-
211
-
212
-
213
-
214
-
215
-
216
-
217
-
218
-
219
-
220
-
221
-
222
-
223
-
224
-
225
-
226
-
227
-
228
-
229
-
230
-
231
-
232
-
233
-
234
-
235
-
236
-
237
-
238
-
239
-
240
-
241
-
242
-
243
-
244
-
245
-
246
-
247
-
248
-
249
-
250
-
251
-
252
-
253
 |
 |
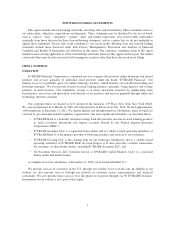
STRATEGY
Our core business is our trading and investing customer franchise. Building on the strengths of this
franchise, our strategy is focused on:
•Strengthening our overall financial and franchise position. We are focused on achieving a more
efficient distribution of capital between our regulated entities, improving capital ratios by reducing
risk, deleveraging the balance sheet and reducing costs, and enhancing our enterprise-wide risk
management culture and capabilities.
•Improving our market position in our retail brokerage business. We plan to accelerate the growth in
our customer franchise and to continue enhancing the customer experience.
•Capitalizing on the value of our complementary brokerage businesses. Our corporate services and
market making businesses enhance our strategy by allowing us to realize additional economic benefit
from our retail brokerage business.
•Enhancing our position in retirement and investing. We believe growing our retirement and investing
products and services is key to our long term success. Our primary focus is to expand the reach of our
brand along with the awareness of our products to this key customer segment.
•Continuing to manage and de-risk the Bank. We are focused on optimizing the value of customer
deposits, while continuing to mitigate credit losses in our loan portfolio, and improving the Bank’s risk
profile. In addition, we do not plan to offer new banking products to customers, including mortgages.
PRODUCTS AND SERVICES
We assess the performance of our business based on our segments, trading and investing and balance sheet
management. We consider multiple factors, including the competitiveness of our pricing compared to similar
products and services in the market, the overall profitability of our businesses and customer relationships when
pricing our various products and services. We manage the performance of our business using various customer
activity and financial metrics, including daily average revenue trades (“DARTs”), average commission per trade,
margin receivables, end of period brokerage accounts, net new brokerage accounts, brokerage account attrition
rate, customer assets, net new brokerage assets, brokerage related cash, corporate cash, E*TRADE Financial Tier
1 leverage and common ratios, E*TRADE Bank Tier 1 leverage ratio, special mention loan delinquencies,
allowance for loan losses, enterprise net interest spread and average enterprise interest-earning assets. Costs
associated with certain functions that are centrally-managed are separately reported in a corporate/other category.
Trading and Investing
Our trading and investing segment offers a full suite of financial products and services to individual retail
investors. The most significant of these products and services are described below:
Trading Products and Services
• automated order placement and execution of U.S. equities, futures, options, exchange-traded funds,
forex and bond orders;
• FDIC insured sweep deposit accounts that automatically transfer funds to and from customer brokerage
accounts;
• access to E*TRADE Mobile, which allows customers to securely trade, monitor real-time investment,
market and account information and transfer funds between accounts via iPhone®, iPad®, AndroidTM,
Windows®Phone or BlackBerry®;
• use of E*TRADE Pro, our desktop trading software for qualified active traders, which provides
customers with customization capabilities, an expanded feature set, news and information, plus live
streaming news via CNBC TV;
2