Westjet 2006 Annual Report Download - page 23
Download and view the complete annual report
Please find page 23 of the 2006 Westjet annual report below. You can navigate through the pages in the report by either clicking on the pages listed below, or by using the keyword search tool below to find specific information within the annual report.-
 1
1 -
2
-
3
-
4
-
5
-
6
-
7
-
8
-
9
-
10
-
11
-
12
-
 13
13 -
 14
14 -
 15
15 -
 16
16 -
 17
17 -
 18
18 -
 19
19 -
 20
20 -
 21
21 -
 22
22 -
 23
23 -
 24
24 -
 25
25 -
 26
26 -
 27
27 -
 28
28 -
 29
29 -
 30
30 -
 31
31 -
 32
32 -
 33
33 -
34
-
35
-
36
-
37
-
38
-
39
-
40
-
41
-
42
-
43
-
44
-
45
-
46
-
47
-
48
-
49
-
50
-
51
-
52
-
53
-
54
-
55
-
56
-
57
-
58
-
59
-
60
 |
 |

212006 | WestJet Annual Report
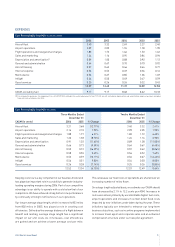
AIRPORT OPERATIONS
Our airport operations encompass costs associated with landing
and terminal fees, ground handling and onboard services, such
as buy-on-board food. Airport CASM increased 2.0% in 2006
to 2.09 cents from 2.05 cents. For the three months ended
December 31, 2006, the CASM for airport operations increased
by 1.9% over the same period in 2005.
In 2006, costs per departure increased 6.7% over 2005’s costs,
primarily driven by our increased transborder fl ights; utilization
of larger aircraft which drove higher fees; and an increased
number of fl ights fl ying into one of the busiest and most costly
airports in the world, Toronto’s Lester B. Pearson International
Airport.
Fee increases imposed by our airport and ground-handling
partners impacted us on average by approximately 6%. These
costs were further magnifi ed by our expanding international
charter and transborder operations, where the number of
departures grew by 7.9% in 2006 over 2005 and are charged
higher rates and fees compared with our domestic operations.
Our cost per departure for transborder and charter operations is
approximately 263% higher than that of our domestic fl ights.
Despite higher fees and costs per departure, our airport CASM
grew at a lesser rate primarily as a consequence of the increase
in our average stage length.
Airport operations make up one of our largest costs, representing
approximately 17% of our total operating expenditures. As we
continue to expand our transborder and international network,
these expenses will continue to be signifi cant to our operations.
In order for us to properly manage these costs, generally
controlled by airport authorities, we continually look for ways
we can improve productivity and reduce operational costs while
at the same time increasing the convenience to our guests.
We do this by seeking opportunities to automate our airport
operations, offering our guests convenient online check-in
services for destinations within Canada, as well as equipping
most of our airports with self-service kiosks.
The rise in unit costs for the quarter can be attributed to an
increase in our system-wide weighted average airport rates
and fees increasing by approximately 6%. Our transborder and
charter activity incur higher airport fees than our Canadian
operations, and the higher terminal and landing fees associated
with operating our larger 700-series and 800-series aircraft also
contributed to higher unit costs.
We are encouraged by the slowing pace of airport rates and fee
increases that we witnessed in 2006, as well as this continuing trend
in 2007 – based on the fee schedule released in January 2007.
FLIGHT OPERATIONS
Our fl ight operations are largely driven by the cost to compensate
our pilots, including salaries, training and stock option expense.
Our CASM for fl ight operations increased by 18.6% during the
fourth quarter and 15.4% for the full year 2006, over the same
periods in 2005. The increase in these costs is primarily due to a
new pilot agreement designed to improve our pilots’ compensation
structure and increase productivity. Approved in the beginning of
the year, this agreement allows our pilots to elect to receive a
certain amount of cash in lieu of a selected portion of their stock
options. In addition to the operational benefi ts we derive from this
new agreement, we also benefi t from the tax deductibility of the
elected cash outlay, whereas we do not realize any tax benefi ts
from stock-based compensation expense.
In the fi rst year of this new agreement, we incurred both a cash
expense, for the cash-elected portion under the new agreement,
as well as stock-based compensation expense related to the
options that were granted to all pilots in May of 2006 under
the terms of the old pilot agreement. As a result, in addition
to stock-based compensation expense, we incurred a cash
expense of $10.2 million and $3.8 million at year-end and in
the fourth quarter of 2006, respectively. Commencing in 2007,
we expect our stock-based compensation expense to decrease
as a result of the lower number of options issued due to pilots
electing to receive greater cash compensation in the fi rst year
of the new agreement. In 2006, we recognized $21.2 million in
stock-based compensation expense, an increase of 20.5% as
compared to $17.6 million in 2005.
NAVIGATIONAL CHARGES
Air navigational charges are predominantly driven by the size of
aircraft and distance fl own, and are administered on a per-fl ight
basis. On a per-departure basis, Nav Canada and FAA costs
rose 3.3% in 2006 over 2005, driven by higher fees associated
with operating larger Next-Generation 737 aircraft and our 3.9%
increase in average stage length. On a per-ASM basis, our year-
over-year navigational charges have declined by approximately
1%, primarily as a result of the growth in our network capacity
outpacing the increase in our number of fl ights.
SALES AND MARKETING
Sales and marketing encompasses a wide variety of expenses
related to advertising and promotions, travel agency commissions,
corporate incentive programs, credit card fees, global distribution
system costs, the AIR MILES® reward miles program costs,
and live satellite television licensing fees. CASM for sales and
marketing expenses increased 6.9%, from 1.16 cents in 2005
to 1.24 cents in 2006.