Westjet 2006 Annual Report Download - page 21
Download and view the complete annual report
Please find page 21 of the 2006 Westjet annual report below. You can navigate through the pages in the report by either clicking on the pages listed below, or by using the keyword search tool below to find specific information within the annual report.-
 1
1 -
2
-
3
-
4
-
5
-
6
-
7
-
8
-
9
-
10
-
 11
11 -
 12
12 -
 13
13 -
 14
14 -
 15
15 -
 16
16 -
 17
17 -
 18
18 -
 19
19 -
 20
20 -
 21
21 -
 22
22 -
 23
23 -
 24
24 -
 25
25 -
 26
26 -
 27
27 -
 28
28 -
 29
29 -
 30
30 -
 31
31 -
32
-
33
-
34
-
35
-
36
-
37
-
38
-
39
-
40
-
41
-
42
-
43
-
44
-
45
-
46
-
47
-
48
-
49
-
50
-
51
-
52
-
53
-
54
-
55
-
56
-
57
-
58
-
59
-
60
 |
 |

192006 | WestJet Annual Report
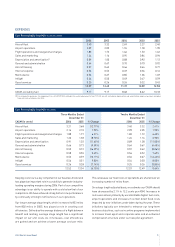
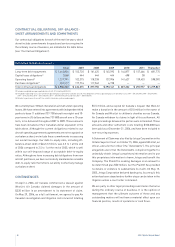
EXPENSES
Cost Per Available Seat Mile (CASM) (IN CENTS)
2006 2005 2004 2003 2002
Aircraft fuel 3.40 3.32 2.69 2.27 2.40
Airport operations 2.09 2.05 1.94 1.78 1.90
Flight operations and navigational charges 1.83 1.72 1.66 1.53 1.63
Sales and marketing 1.24 1.16 0.95 0.84 0.96
Depreciation and amortization(1) 0.89 1.00 0.88 0.92 1.13
General and administration 0.64 0.67 0.70 0.70 0.92
Aircraft leasing 0.57 0.62 0.46 0.64 0.77
Interest expense 0.56 0.52 0.49 0.36 0.16
Maintenance 0.56 0.67 0.85 1.06 1.69
Infl ight 0.54 0.50 0.49 0.47 0.59
Guest services 0.25 0.26 0.26 0.32 0.43
12.57 12.49 11.37 10.89 12.58
CASM, excluding fuel 9.17 9.17 8.68 8.62 10.18
(1) For comparative purposes, the impairment loss of $47,577,000, related to the early replacement of our 737-200 aircraft, included in depreciation and amortization expense has been excluded
from unit-cost calculations for 2004.
Cost Per Available Seat Mile (IN CENTS)
Three Months Ended Twelve Months Ended
December 31 December 31
CASM (in cents) 2006 2005 % Change 2006 2005 % Change
Aircraft fuel 3.21 3.68 (12.77%) 3.40 3.32 2.41%
Airport operations 2.14 2.10 1.90% 2.09 2.05 1.95%
Flight operations and navigational charges 1.88 1.77 6.21% 1.83 1.72 6.40%
Sales and marketing 1.26 1.38 (8.70%) 1.24 1.16 6.90%
Depreciation and amortization 0.91 1.03 (11.65%) 0.89 1.00 (11.00%)
General and administration 0.66 0.73 (9.59%) 0.64 0.67 (4.48%)
Aircraft leasing 0.53 0.72 (26.39%) 0.57 0.62 (8.06%)
Interest expense 0.58 0.55 5.45% 0.56 0.52 7.69%
Maintenance 0.53 0.59 (10.17%) 0.56 0.67 (16.42%)
Infl ight 0.56 0.51 9.80% 0.54 0.50 8.00%
Guest services 0.26 0.28 (7.14%) 0.25 0.26 (3.85%)
12.52 13.34 (6.15%) 12.57 12.49 0.64%
Keeping costs low is a key component of our business model and
has played an important role in our ability to generate industry-
leading operating margins during 2006. Part of our competitive
advantage is our ability to operate with costs below that of our
competitors. We have achieved strong bottom-line performance
by continually striving for effi ciencies in our operations.
Our longer average stage length, which increased to 833 miles
from 802 miles in 2005, has played a role in creating cost
effi ciencies. Defi ned as the average distance of a fl ight between
takeoff and landing, average stage length has a signifi cant
impact on our unit costs. As it increases, cost effi ciencies
are gained and we achieve a lower average cost per mile.
This is because our fi xed costs of operations are shared over an
increasing number of miles fl own.
On a stage length adjusted basis, we estimate our CASM should
have decreased by 2.1% to 12.2 cents per ASM. Increases in
costs were driven primarily by uncontrollable higher fuel costs,
airport operations and increases in certain direct fi xed costs
impacted by new initiatives undertaken during the year. These
initiatives typically are intended to enhance our long-term
business objectives, such as incentive programs implemented
to increase travel agent and corporate sales and an enhanced
compensation structure under our new pilot agreement.