Westjet 2006 Annual Report Download - page 20
Download and view the complete annual report
Please find page 20 of the 2006 Westjet annual report below. You can navigate through the pages in the report by either clicking on the pages listed below, or by using the keyword search tool below to find specific information within the annual report.-
 1
1 -
2
-
3
-
4
-
5
-
6
-
7
-
8
-
9
-
 10
10 -
 11
11 -
 12
12 -
 13
13 -
 14
14 -
 15
15 -
 16
16 -
 17
17 -
 18
18 -
 19
19 -
 20
20 -
 21
21 -
 22
22 -
 23
23 -
 24
24 -
 25
25 -
 26
26 -
 27
27 -
 28
28 -
 29
29 -
 30
30 -
31
-
32
-
33
-
34
-
35
-
36
-
37
-
38
-
39
-
40
-
41
-
42
-
43
-
44
-
45
-
46
-
47
-
48
-
49
-
50
-
51
-
52
-
53
-
54
-
55
-
56
-
57
-
58
-
59
-
60
 |
 |

18 2006 | WestJet Annual Report
Our business is seasonal in nature with varying levels of activity
throughout the year. We experience increased domestic travel
in the summer months (second and third quarters) and more
demand for transborder and charter sun destinations over the
winter period (fourth and fi rst quarters). With the introduction
of our fi rst transborder destination in September 2004, we
have been able to somewhat alleviate the affects of seasonality
on our net earnings. In 2006, we focused on allocating our
network capacity to our domestic and transborder markets as
appropriate based on demand in the season.
In the quarter ended March 31, 2005, we reported a net loss of
$9.6 million as a result of the impact of lower fares throughout
the domestic airline system driven by intense competition
and extremely high fuel prices. This created a high-cost and
low-yield environment. Market rationalization was reinstated
at the end of March 2005 when Jetsgo ceased operations. This
materially changed our operating environment and we began
to witness signifi cant improvements in our yield.
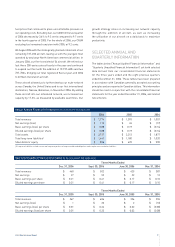
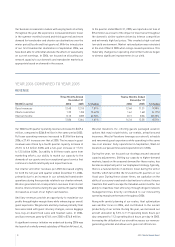
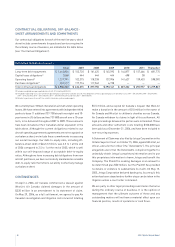
YEAR 2006 COMPARED TO YEAR 2005
REVENUE
Three Months Ended Twelve Months Ended
December 31 December 31
RASM (in cents) 2006 2005 % Change 2006 2005 % Change
Guest revenues 12.40 12.18 1.81% 12.44 11.31 9.99%
Charter and other 1.33 1.38 (3.62%) 1.61 1.68 (4.17%)
Interest income 0.13 0.08 62.50% 0.11 0.06 83.33%
13.86 13.64 1.61% 14.16 13.05 8.51%
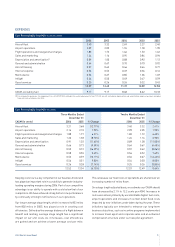
Our 2006 fourth quarter operating revenues increased to $459.6
million, compared to $366.8 million in the same period 2005.
Full-year operating revenues increased to $1.8 billion during
2006, a 27.4% increase over that of 2005. The increase in guest
revenues was driven by a fourth quarter capacity increase of
23.3% to 3.3 billion ASMs and a full-year increase of 17.3%
to 12.5 billion ASMs. Our ability to fi ll these seats came from
marketing efforts, our ability to match our capacity to the
demands of our guests and our exceptional guest service that
continues to build brand loyalty and repeat business.
Our charter and other revenues per ASM decreased slightly
for both the full year and quarter ended December 31, 2006,
primarily due to an increase in our scheduled transborder
operations during these periods relative to our charter network.
We also generated non-transportation revenues from interest
income. Interest income during the year and fourth quarter 2006
increased as a result of our higher cash balance.
Ancillary revenues provide an opportunity to maximize our
profi ts through higher margin items while enhancing our overall
guest experience. We generate ancillary revenue primarily from
fees associated with guest itinerary changes, excess baggage
fees, buy-on-board food sales and headset sales. In 2006,
ancillary revenues grew by 67.6% over 2005 to $74.8 million.
A signifi cant revenue initiative we undertook during 2006 was
the launch of a wholly owned subsidiary of WestJet Airlines Ltd.,
WestJet Vacations Inc. offering guests packaged vacation
options that may include hotels, car rentals, attractions and
insurance. WestJet Vacations leverages our aircraft, schedule
and renowned guest experience while operating in the same
low-cost manner. Fully operational in September, WestJet
Vacations surpassed forecasted expectations for 2006.
During the year, we focused our strategy around seasonal
capacity adjustments. Shifting our capacity to higher-demand
markets, based on the seasonal demand for those routes, has
become an important part of our deployment strategy. Typically,
there is a natural decline in domestic travel during the winter
months, which fall within the fi rst and fourth quarters of our
fi scal year. During these slower times, we capitalize on the
ability of our sunny transborder destinations to attract leisure
travellers that want to escape the Canadian winter months. Our
ability to maximize fl eet effi ciency through diligent network
management has directly contributed to our noteworthy
operating margin performance throughout 2006.
Along with careful planning of our routes, fl eet optimization
was another focus in 2006, and contributed to the overall
productivity of our airline. During the year, we increased our
aircraft utilization by 5.3% to 11.9 operating block hours per
day compared to 11.3 operating block hours per day in 2005.
Increasing the utilization of our aircraft increases our revenue-
generating potential and allows us to gain cost effi ciencies.