Vonage 2012 Annual Report Download - page 39
Download and view the complete annual report
Please find page 39 of the 2012 Vonage annual report below. You can navigate through the pages in the report by either clicking on the pages listed below, or by using the keyword search tool below to find specific information within the annual report.-
 1
1 -
2
-
3
-
4
-
5
-
6
-
7
-
8
-
9
-
10
-
11
-
12
-
13
-
14
-
15
-
16
-
17
-
18
-
19
-
20
-
21
-
22
-
23
-
24
-
25
-
26
-
27
-
28
-
 29
29 -
 30
30 -
 31
31 -
 32
32 -
 33
33 -
 34
34 -
 35
35 -
 36
36 -
 37
37 -
 38
38 -
 39
39 -
 40
40 -
 41
41 -
 42
42 -
 43
43 -
 44
44 -
 45
45 -
 46
46 -
 47
47 -
 48
48 -
 49
49 -
50
-
51
-
52
-
53
-
54
-
55
-
56
-
57
-
58
-
59
-
60
-
61
-
62
-
63
-
64
-
65
-
66
-
67
-
68
-
69
-
70
-
71
-
72
-
73
-
74
-
75
-
76
-
77
-
78
-
79
-
80
-
81
-
82
-
83
-
84
-
85
-
86
-
87
-
88
-
89
-
90
-
91
-
92
-
93
-
94
 |
 |

33 VONAGE ANNUAL REPORT 2012
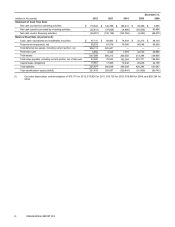
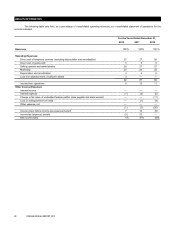
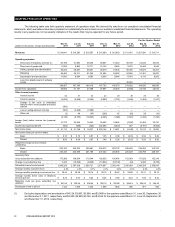
QUARTERLY RESULTS OF OPERATIONS
The following table sets forth quarterly statement of operations data. We derived this data from our unaudited consolidated financial
statements, which we believe have been prepared on substantially the same basis as our audited consolidated financial statements. The operating
results in any quarter are not necessarily indicative of the results that may be expected for any future period.
For the Quarter Ended
(dollars in thousands, except operating data)
Mar 31,
2011
Jun 30,
2011
Sep 30,
2011
Dec 31,
2011
Mar 31,
2012
Jun 30,
2012
Sep 30,
2012
Dec 31,
2012
Revenues $ 219,841 $ 218,285 $ 216,507 $ 215,690 $ 215,903 $ 211,916 $ 207,584 $ 213,711
Operating expenses:
Direct cost of telephony services (1) 60,189 57,883 59,230 58,847 61,623 58,195 55,245 56,814
Direct cost of goods sold 11,055 9,865 10,711 10,125 9,846 9,275 10,444 9,568
Selling, general and administrative 58,243 58,481 59,451 58,579 61,835 58,396 59,676 62,461
Marketing 49,404 52,211 51,044 51,604 53,422 54,956 51,361 52,801
Depreciation and amortization 11,066 8,664 8,683 8,638 8,644 8,518 8,110 8,052
Loss from abandonment of software
assets —————25,262——
189,957 187,104 189,119 187,793 195,370 214,602 184,836 189,696
Income from operations 29,884 31,181 27,388 27,897 20,533 (2,686) 22,748 24,015
Other income (expense):
Interest income 42 37 33 23 20 30 30 29
Interest expense (6,602) (5,588) (2,926) (2,002) (1,751) (1,566) (1,402) (1,267)
Change in fair value of embedded
features within notes payable and stock
warrant (950)———————
Loss on extinguishment of notes (593)(3,228)(7,985)—————
Other, net (2) 44 (47) (266) 42 (65) 28 (16)
(8,105) (8,735) (10,925) (2,245) (1,689) (1,601) (1,344) (1,254)
Income (loss) before income tax (expense)
benefit 21,779 22,446 16,463 25,652 18,844 (4,287) 21,404 22,761
Income tax (expense) benefit (666) (698) (426) 324,494 (4,923) 947 (8,191) (9,928)
Net income (loss) $ 21,113 $ 21,748 $ 16,037 $ 350,146 $ 13,921 $ (3,340) $ 13,213 $ 12,833
Net income (loss) per common share:
Basic $ 0.10 $ 0.10 $ 0.07 $ 1.55 $ 0.06 $ (0.01) $ 0.06 $ 0.06
Diluted $ 0.09 $ 0.09 $ 0.07 $ 1.48 $ 0.06 $ (0.01) $ 0.06 $ 0.06
Weighted-average common shares
outstanding:
Basic 222,162 224,233 225,281 225,572 225,732 226,429 225,555 219,379
Diluted 240,340 244,590 241,189 237,342 236,036 226,429 233,708 228,107
Operating Data:
Gross subscriber line additions 175,388 158,004 170,344 168,538 165,454 163,349 171,628 152,319
Change in net subscriber line 3,345 (10,568) (8,939) (13,834) (18,739) (64) 9,440 (5,708)
Subscriber lines at end of period 2,408,228 2,397,660 2,388,721 2,374,887 2,356,148 2,356,084 2,365,524 2,359,816
Average monthly customer churn 2.5% 2.5% 2.7% 2.7% 2.8% 2.5% 2.5% 2.5%
Average monthly operating revenues per line $ 30.45 $ 30.28 $ 30.16 $ 30.19 $ 30.42 $ 29.98 $ 29.31 $ 30.15
Average monthly direct costs of telephony
services per line $ 8.34 $ 8.03 $ 8.25 $ 8.24 $ 8.68 $ 8.23 $ 7.80 $ 8.02
Marketing costs per gross subscriber line
additions $ 281.68 $ 330.44 $ 299.65 $ 306.19 $ 322.88 $ 336.43 $ 299.26 $ 346.65
Employees at end of period 1,126 1,059 1,035 1,008 1,004 988 971 983
(1) Excludes depreciation and amortization of $4,124, $3,867, $3,864, and $3,969 for the quarters ended March 31, June 30, September 30
and December 31, 2011, respectively, and $3,930, $3,929, $3,722, and $3,534 for the quarters ended March 31, June 30, September 30
and December 31, 2012, respectively.
.