Vodafone 2016 Annual Report Download - page 32
Download and view the complete annual report
Please find page 32 of the 2016 Vodafone annual report below. You can navigate through the pages in the report by either clicking on the pages listed below, or by using the keyword search tool below to find specific information within the annual report.-
 1
1 -
2
-
3
-
4
-
5
-
6
-
7
-
8
-
9
-
10
-
11
-
12
-
13
-
14
-
15
-
16
-
17
-
18
-
19
-
20
-
21
-
 22
22 -
 23
23 -
 24
24 -
 25
25 -
 26
26 -
 27
27 -
 28
28 -
 29
29 -
 30
30 -
 31
31 -
 32
32 -
 33
33 -
 34
34 -
 35
35 -
 36
36 -
 37
37 -
 38
38 -
 39
39 -
 40
40 -
 41
41 -
 42
42 -
43
-
44
-
45
-
46
-
47
-
48
-
49
-
50
-
51
-
52
-
53
-
54
-
55
-
56
-
57
-
58
-
59
-
60
-
61
-
62
-
63
-
64
-
65
-
66
-
67
-
68
-
69
-
70
-
71
-
72
-
73
-
74
-
75
-
76
-
77
-
78
-
79
-
80
-
81
-
82
-
83
-
84
-
85
-
86
-
87
-
88
-
89
-
90
-
91
-
92
-
93
-
94
-
95
-
96
-
97
-
98
-
99
-
100
-
101
-
102
-
103
-
104
-
105
-
106
-
107
-
108
-
109
-
110
-
111
-
112
-
113
-
114
-
115
-
116
-
117
-
118
-
119
-
120
-
121
-
122
-
123
-
124
-
125
-
126
-
127
-
128
-
129
-
130
-
131
-
132
-
133
-
134
-
135
-
136
-
137
-
138
-
139
-
140
-
141
-
142
-
143
-
144
-
145
-
146
-
147
-
148
-
149
-
150
-
151
-
152
-
153
-
154
-
155
-
156
-
157
-
158
-
159
-
160
-
161
-
162
-
163
-
164
-
165
-
166
-
167
-
168
-
169
-
170
-
171
-
172
-
173
-
174
-
175
-
176
-
177
-
178
-
179
-
180
-
181
-
182
-
183
-
184
-
185
-
186
-
187
-
188
-
189
-
190
-
191
-
192
-
193
-
194
-
195
-
196
-
197
-
198
-
199
-
200
-
201
-
202
-
203
-
204
-
205
-
206
-
207
-
208
 |
 |

Operating results
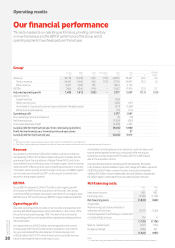
Our nancial performance
This section presents our operating performance, providing commentary
on how the revenue and the EBITDA performance of the Group and its
operating segments have developed over the last year.
Group1
Europe
£m
AMAP
£m
Other2
£m
Eliminations
£m
2016
£m
2015
£m
% change
£Organic
Revenue 26,718 13, 208 1,16 0 (113) 40,973 42,227 (3.0) 2.3
Service revenue 24,461 11, 8 43 968 (113 ) 3 7,159 38,497 (3.5) 1.5
Other revenue 2,257 1,365 192 –3,814 3,730
EBITDA 7, 6 86 4,042 (116 ) –11, 612 11, 915 (2.5) 2.7
Adjusted operating prot 1,409 1,813 (105) –3 ,117 3,507 (11.1) (3.9)
Adjustments for:
Impairment loss (450) –
Restructuring costs (236) (157)
Amortisation of acquired customer bases and brand intangible assets (979) (1,269)
Other income and expense (75) (114 )
Operating prot 1,377 1,967
Non-operating income and expense (2) (19)
Net nancing costs (1,824) (853)
Income tax (expense)/credit (3,369) 4,765
(Loss)/prot for the nancial year from continuing operations (3,818) 5,860
Prot for the nancial year from discontinued operations – 57
(Loss)/prot for the nancial year (3,818) 5,917
Notes:
1 2016 results reect average foreign exchange rates of £1:€1.37, £1:INR 98.61 and £1:ZAR 20.72.
2 The “Other” segment primarily represent the results of the partner markets and the net result of unallocated central Group costs.
Revenue
Group revenue decreased 3.0% to £41.0 billion and service revenue
decreased by 3.5% to £37.2 billion. Reported growth includes the full
year impact from the acquisitions of Hellas Online (‘HOL’) and Cobra
Automotive (‘Cobra’) in the prior year. In Europe, organic service revenue
declined 0.6%* reecting continued competitive pressures in a number
of markets, with improving trends throughout the year. In AMAP, organic
service revenue increased by 6.9%* continuing its sustained track
record of strong organic growth.
EBITDA
Group EBITDA declined 2.5% to £11.6 billion, with organic growth
in Europe and AMAP and the acquisitions of HOL and Cobra being
more than offset by foreign exchange movements. On an organic basis,
EBITDA rose 2.7%* and the Group’s EBITDA margin stabilised at 28.3%.
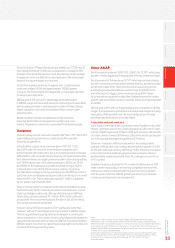
Operating prot
Adjusted operating prot excludes certain income and expenses that
we have identied separately to allow their effect on the results of the
Group to be assessed (see page 190). The items that are included
in operating prot but are excluded from adjusted operating prot are
discussed below.
An impairment loss of £450 million was recognised in the current
nancial year (2015: £nil). Further detail is provided in note 4 to the
Group’s consolidated nancial statements. Restructuring costs
of £236 million (2015: £157 million) have been incurred to improve
future business performance and reduce costs.
Amortisation of intangible assets in relation to customer bases and
brands are recognised under accounting rules after we acquire
businesses and decreased to £979 million (2015: £1,269 million)
due to the acquisition of Ono.
Including the above items, operating profit decreased by £0.6 billion
to £1.4 billion as the £0.45 billion impairment charge, £0.3 billion reduction
in EBITDA and £0.1 billion increase in restructuring costs were partly
offset by £0.1 billion of lower depreciation and amortisation charges and
£0.1 billion higher contribution from associates and joint ventures.
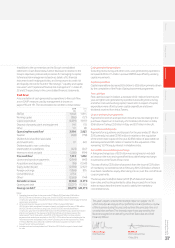
Net nancing costs
2016
£m
2015
£m
Investment income 300 883
Financing costs (2,124) (1.736)
Net nancing costs (1,824) (853)
Analysed as:
Net nancing costs before interest on
settlement of tax issues (1,107) (1,160)
Interest (expense)/credit arising on settlement
of outstanding tax issues (15) 4
(1,122) (1,156)
Mark-to-market losses (247) (134)
Foreign exchange1(455) 437
(1,824) (853)
Note:
1 Comprises foreign exchange rate differences in relation to certain intercompany balances.
Vodafone Group Plc
Annual Report 2016
30