Vodafone 2016 Annual Report Download - page 130
Download and view the complete annual report
Please find page 130 of the 2016 Vodafone annual report below. You can navigate through the pages in the report by either clicking on the pages listed below, or by using the keyword search tool below to find specific information within the annual report.-
 1
1 -
2
-
3
-
4
-
5
-
6
-
7
-
8
-
9
-
10
-
11
-
12
-
13
-
14
-
15
-
16
-
17
-
18
-
19
-
20
-
21
-
22
-
23
-
24
-
25
-
26
-
27
-
28
-
29
-
30
-
31
-
32
-
33
-
34
-
35
-
36
-
37
-
38
-
39
-
40
-
41
-
42
-
43
-
44
-
45
-
46
-
47
-
48
-
49
-
50
-
51
-
52
-
53
-
54
-
55
-
56
-
57
-
58
-
59
-
60
-
61
-
62
-
63
-
64
-
65
-
66
-
67
-
68
-
69
-
70
-
71
-
72
-
73
-
74
-
75
-
76
-
77
-
78
-
79
-
80
-
81
-
82
-
83
-
84
-
85
-
86
-
87
-
88
-
89
-
90
-
91
-
92
-
93
-
94
-
95
-
96
-
97
-
98
-
99
-
100
-
101
-
102
-
103
-
104
-
105
-
106
-
107
-
108
-
109
-
110
-
111
-
112
-
113
-
114
-
115
-
116
-
117
-
118
-
119
-
 120
120 -
 121
121 -
 122
122 -
 123
123 -
 124
124 -
 125
125 -
 126
126 -
 127
127 -
 128
128 -
 129
129 -
 130
130 -
 131
131 -
 132
132 -
 133
133 -
 134
134 -
 135
135 -
 136
136 -
 137
137 -
 138
138 -
 139
139 -
 140
140 -
141
-
142
-
143
-
144
-
145
-
146
-
147
-
148
-
149
-
150
-
151
-
152
-
153
-
154
-
155
-
156
-
157
-
158
-
159
-
160
-
161
-
162
-
163
-
164
-
165
-
166
-
167
-
168
-
169
-
170
-
171
-
172
-
173
-
174
-
175
-
176
-
177
-
178
-
179
-
180
-
181
-
182
-
183
-
184
-
185
-
186
-
187
-
188
-
189
-
190
-
191
-
192
-
193
-
194
-
195
-
196
-
197
-
198
-
199
-
200
-
201
-
202
-
203
-
204
-
205
-
206
-
207
-
208
 |
 |

Vodafone Group Plc
Annual Report 2016
128
Notes to the consolidated nancial statements (continued)
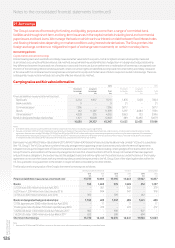
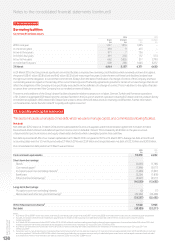
21. Borrowings (continued)
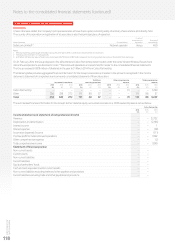
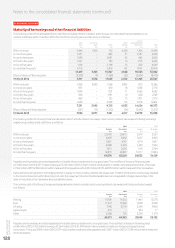
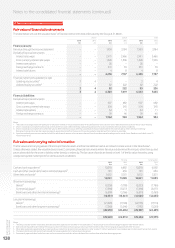
Maturity of borrowings and other nancial liabilities
The maturity prole of the anticipated future cash ows including interest in relation to the Group’s non-derivative nancial liabilities on an
undiscounted basis which, therefore, differs from both the carrying value and fair value, is as follows:
Loans in
Bank Commercial Other designated hedge
loans paper Bonds liabilities relationships Total
£m £m £m £m £m £m
Within one year 2,444 7,4 0 5 703 4,338 1,304 16,194
In one to two years 1,257 – 889 57 2,787 4,990
In two to three years 1,599 – 2,681 43 686 5,009
In three to four years 1,297 – 180 14 1,175 2,666
In four to ve years 1,106 – 2,798 15 630 4,549
In more than ve years 4,716 – 5,816 141 9,741 20,414
12,419 7, 4 0 5 13,067 4,608 16,323 53,822
Effect of discount/nancing rates (3,208) (9) (1,368) (36) (3,854) (8,475)
31 March 2016 9,211 7, 3 96 11,699 4,572 12,469 45,347
Within one year 1,928 5,092 1,588 3,885 873 13,366
In one to two years 831 – 610 18 1,256 2,715
In two to three years 1,090 – 831 11 2,650 4,582
In three to four years 920 – 1,191 12 626 2,749
In four to ve years 862 – 135 12 1,101 2,110
In more than ve years 1,660 – 4,958 115 8,118 14,851
7, 2 91 5,092 9,313 4,053 14,624 40,373
Effect of discount/nancing rates (287) (15) (1,332) (36) (3,645) (5,315)
31 March 2015 7, 0 0 4 5,077 7, 98 1 4,017 10,979 35,058
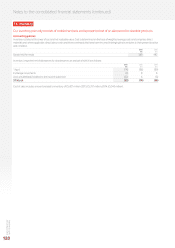
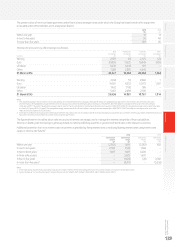
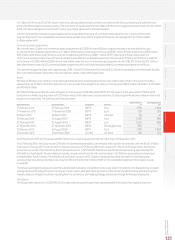
The maturity prole of the Group’s nancial derivatives (which include interest rate swaps, cross currency interest rate swaps and foreign exchange
swaps) using undiscounted cash ows, is as follows:
2016 2015
Payable Receivable Payable Receivable
£m £m £m £m
Within one year 25,990 26,912 2,647 3,537
In one to two years 8,429 8,632 5,457 4,005
In two to three years 3,807 4,147 4,179 4,617
In three to four years 2,088 2,363 1,430 1,942
In four to ve years 1,913 2,050 1,145 2,164
In more than ve years 18,851 20,897 13,177 17,864
61,078 65,001 28,035 34,129
Payables and receivables are stated separately in the table above as settlement is on a gross basis. The net effect of discount/nancing rates
is £1,183 million (2015: £3,073 million), leaving a £2,740 million (2015: £3,021 million) net receivable in relation to nancial instruments. This is split
£1,564 million (2015: £984 million) within trade and other payables and £4,304 million (2015: £4,005 million) within trade and other receivables.
Gains and losses recognised in the hedging reserve in equity on cross currency interest rate swaps as at 31 March 2016 will be continuously released
to the income statement within nancing costs until the repayment of certain bonds classied as loans designated in hedge relationships in the
table of maturities of non-derivative nancial liabilities above.
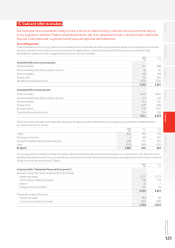
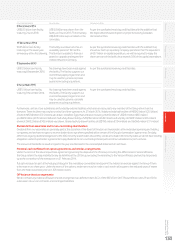
The currency split of the Group’s foreign exchange derivatives (which includes cross currency interest rate swaps and foreign exchange swaps)
is as follows:
2016 2015
Payable Receivable Payable Receivable
£m £m £m £m
Sterling 17, 8 9 0 14, 253 11 ,4 61 12,578
Euro 11, 67 2 19,369 8,158 6,228
US dollar 7, 74 8 10 ,178 5,598 9,908
Japanese yen 673 – 594 17
Other 5,388 795 3,238 1,374
43,371 44,595 29,049 30 ,10 5
Payables and receivables are stated separately in the table above as settlement is on a gross basis. The net effect of discount/nancing rates
is £40 million (2015: £192 million), leaving a £1,264 million (2015: £1,248 million) net receivable in relation to foreign exchange nancial
instruments. This is split £593 million (2015: £291 million) within trade and other payables and £1,857 million (2015: £1,539 million) within trade and
other receivables.