Vodafone 2016 Annual Report Download - page 103
Download and view the complete annual report
Please find page 103 of the 2016 Vodafone annual report below. You can navigate through the pages in the report by either clicking on the pages listed below, or by using the keyword search tool below to find specific information within the annual report.-
 1
1 -
2
-
3
-
4
-
5
-
6
-
7
-
8
-
9
-
10
-
11
-
12
-
13
-
14
-
15
-
16
-
17
-
18
-
19
-
20
-
21
-
22
-
23
-
24
-
25
-
26
-
27
-
28
-
29
-
30
-
31
-
32
-
33
-
34
-
35
-
36
-
37
-
38
-
39
-
40
-
41
-
42
-
43
-
44
-
45
-
46
-
47
-
48
-
49
-
50
-
51
-
52
-
53
-
54
-
55
-
56
-
57
-
58
-
59
-
60
-
61
-
62
-
63
-
64
-
65
-
66
-
67
-
68
-
69
-
70
-
71
-
72
-
73
-
74
-
75
-
76
-
77
-
78
-
79
-
80
-
81
-
82
-
83
-
84
-
85
-
86
-
87
-
88
-
89
-
90
-
91
-
92
-
 93
93 -
 94
94 -
 95
95 -
 96
96 -
 97
97 -
 98
98 -
 99
99 -
 100
100 -
 101
101 -
 102
102 -
 103
103 -
 104
104 -
 105
105 -
 106
106 -
 107
107 -
 108
108 -
 109
109 -
 110
110 -
 111
111 -
 112
112 -
 113
113 -
114
-
115
-
116
-
117
-
118
-
119
-
120
-
121
-
122
-
123
-
124
-
125
-
126
-
127
-
128
-
129
-
130
-
131
-
132
-
133
-
134
-
135
-
136
-
137
-
138
-
139
-
140
-
141
-
142
-
143
-
144
-
145
-
146
-
147
-
148
-
149
-
150
-
151
-
152
-
153
-
154
-
155
-
156
-
157
-
158
-
159
-
160
-
161
-
162
-
163
-
164
-
165
-
166
-
167
-
168
-
169
-
170
-
171
-
172
-
173
-
174
-
175
-
176
-
177
-
178
-
179
-
180
-
181
-
182
-
183
-
184
-
185
-
186
-
187
-
188
-
189
-
190
-
191
-
192
-
193
-
194
-
195
-
196
-
197
-
198
-
199
-
200
-
201
-
202
-
203
-
204
-
205
-
206
-
207
-
208
 |
 |

Overview Strategy review Performance Governance Financials Additional information
Vodafone Group Plc
Annual Report 2016
101
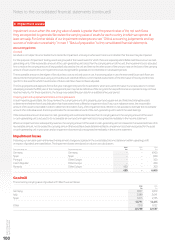
Key assumptions used in the value in use calculations
The key assumptions used in determining the value in use are:
Assumption How determined
Budgeted EBITDA Budgeted EBITDA has been based on past experience adjusted for the following:
a voice and messaging revenue is expected to benet from increased usage from new customers, especially
in emerging markets, the introduction of new services and trafc moving from xed networks to mobile
networks, though these factors will be offset by increased competitor activity, which may result in price
declines, and the trend of falling termination and other regulated rates;
a non-messaging data revenue is expected to continue to grow as the penetration of 3G (plus 4G where
available) enabled devices and smartphones rise along with higher data bundle attachment rates,
and newproducts and services are introduced; and
a margins are expected to be impacted by negative factors such as the cost of acquiring and retaining
customers in increasingly competitive markets and the expectation of further termination rate cuts
by regulators and by positive factors such as the efciencies expected from the implementation
of Groupinitiatives.
Budgeted capital expenditure The cash ow forecasts for capital expenditure are based on past experience and include the ongoing capital
expenditure required to roll out networks in emerging markets, to provide voice and data products and services
and to meet the population coverage requirements of certain of the Group’s licences. Capital expenditure
includes cash outows for the purchase of property, plant and equipment and computer software.
Budgeted licence and spectrum
payments
The cash ow forecasts for licence and spectrum payments for each operating company for the initial ve years
include amounts for expected renewals and newly available spectrum. Beyond that period, a long-run cost of
spectrum is assumed.
Long-term growth rate For businesses where the ve year management plans are used for the Group’s value in use calculations,
along-term growth rate into perpetuity has been determined as the lower of:
a the nominal GDP rates for the country of operation; and
a the long-term compound annual growth rate in EBITDA in years six to ten estimated by management.
Pre-tax risk adjusted discount rate The discount rate applied to the cash ows of each of the Group’s operations is generally based on the risk free
rate for ten year bonds issued by the government in the respective market. Where government bond rates
contain a material component of credit risk, high quality local corporate bond rates may be used.
These rates are adjusted for a risk premium to reect both the increased risk of investing in equities and the
systematic risk of the specic Group operating company. In making this adjustment, inputs required are the
equity market risk premium (that is the required increased return required over and above a risk free rate by an
investor who is investing in the market as a whole) and the risk adjustment, beta, applied to reect the risk of the
specic Group operating company relative to the market as a whole.
In determining the risk adjusted discount rate, management has applied an adjustment for the systematic
risk to each of the Group’s operations determined using an average of the betas of comparable listed mobile
telecommunications companies and, where available and appropriate, across a specic territory. Management
has used a forward-looking equity market risk premium that takes into consideration both studies by
independent economists, the average equity market risk premium over the past ten years and the market risk
premiums typically used by investment banks in evaluating acquisition proposals.
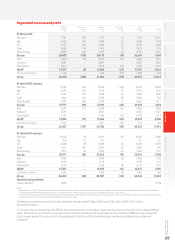
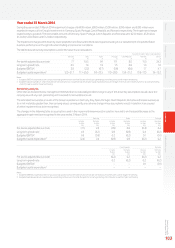
Year ended 31 March 2016
During the year ended 31 March 2016 impairment charges of £450 million were recorded in respect of the Group’s investments in Romania.
The impairment charge relates solely to goodwill. The recoverable amount of Romania is £0.7 billion.
The impairment charges were driven by lower projected cash ows within the business plans resulting in our reassessment of expected future
business performance in the light of the current trading environment.
The table below shows key assumptions used in the value in use calculations.
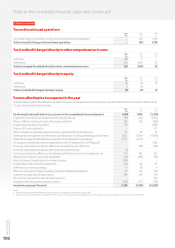
Assumptions used in value in use calculation
Romania Germany Spain
% % %
Pre-tax risk adjusted discount rate 9.7 8.2 9.7
Long-term growth rate 1.0 0.5 1.5
Budgeted EBITDA1(0.3) 3.1 8.8
Budgeted capital expenditure211.5–18.8 14.5–15.6 11.2–19.7
Notes:
1 Budgeted EBITDA is expressed as the compound annual growth rates in the initial ve years for all cash-generating units of the plans used for impairment testing.
2 Budgeted capital expenditure, which excludes licences and spectrum, is expressed as the range of capital expenditure as a percentage of revenue in the initial ve years for all cash-generating
units of the plans used for impairment testing.