Vodafone 2016 Annual Report Download - page 131
Download and view the complete annual report
Please find page 131 of the 2016 Vodafone annual report below. You can navigate through the pages in the report by either clicking on the pages listed below, or by using the keyword search tool below to find specific information within the annual report.-
 1
1 -
2
-
3
-
4
-
5
-
6
-
7
-
8
-
9
-
10
-
11
-
12
-
13
-
14
-
15
-
16
-
17
-
18
-
19
-
20
-
21
-
22
-
23
-
24
-
25
-
26
-
27
-
28
-
29
-
30
-
31
-
32
-
33
-
34
-
35
-
36
-
37
-
38
-
39
-
40
-
41
-
42
-
43
-
44
-
45
-
46
-
47
-
48
-
49
-
50
-
51
-
52
-
53
-
54
-
55
-
56
-
57
-
58
-
59
-
60
-
61
-
62
-
63
-
64
-
65
-
66
-
67
-
68
-
69
-
70
-
71
-
72
-
73
-
74
-
75
-
76
-
77
-
78
-
79
-
80
-
81
-
82
-
83
-
84
-
85
-
86
-
87
-
88
-
89
-
90
-
91
-
92
-
93
-
94
-
95
-
96
-
97
-
98
-
99
-
100
-
101
-
102
-
103
-
104
-
105
-
106
-
107
-
108
-
109
-
110
-
111
-
112
-
113
-
114
-
115
-
116
-
117
-
118
-
119
-
120
-
 121
121 -
 122
122 -
 123
123 -
 124
124 -
 125
125 -
 126
126 -
 127
127 -
 128
128 -
 129
129 -
 130
130 -
 131
131 -
 132
132 -
 133
133 -
 134
134 -
 135
135 -
 136
136 -
 137
137 -
 138
138 -
 139
139 -
 140
140 -
 141
141 -
142
-
143
-
144
-
145
-
146
-
147
-
148
-
149
-
150
-
151
-
152
-
153
-
154
-
155
-
156
-
157
-
158
-
159
-
160
-
161
-
162
-
163
-
164
-
165
-
166
-
167
-
168
-
169
-
170
-
171
-
172
-
173
-
174
-
175
-
176
-
177
-
178
-
179
-
180
-
181
-
182
-
183
-
184
-
185
-
186
-
187
-
188
-
189
-
190
-
191
-
192
-
193
-
194
-
195
-
196
-
197
-
198
-
199
-
200
-
201
-
202
-
203
-
204
-
205
-
206
-
207
-
208
 |
 |

Overview Strategy review Performance Governance Financials Additional information
Vodafone Group Plc
Annual Report 2016
129
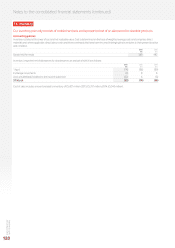
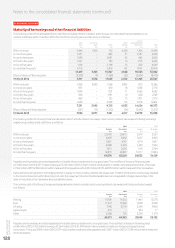
The present value of minimum lease payments under nance lease arrangements under which the Group has leased certain of its equipment
is included within other liabilities and is analysed as follows:
2016 2015
£m £m
Within one year 12 14
In two to ve years 50 40
In more than ve years 109 85
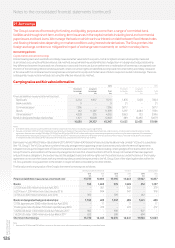
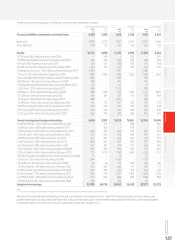
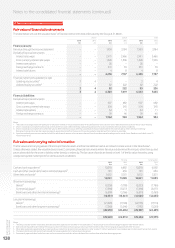
Interest rate and currency of borrowings is as follows:
Total Floating rate Fixed rate Other
borrowings borrowings borrowings1borrowings2
Currency £m £m £m £m
Sterling 2,789 90 2,575 124
Euro 29,900 11,621 16,849 1,430
US dollar 5,632 5,443 189 –
Other 7,026 2,381 4,645 –
31 March 2016 45,347 19,535 24,258 1,554
Sterling 2,10 8 55 2,046 7
Euro 19,531 4,252 13,972 1,307
US dollar 7,9 62 7, 78 2 180 –
Other 5,457 2,898 2,559 –
31 March 2015 35,058 14,987 18,757 1,314
Notes:
1 The weighted average interest rate for the Group’s sterling denominated xed rate borrowings is 4.6% (2015: 6.3%). The weighted average time for which these rates are xed is 6.4years
(2015: 8.1years). The weighted average interest rate for the Group’s euro denominated xed rate borrowings is 2.7% (2015: 3.4%). The weighted average time for which the rates are xed
is 6.5years (2015: 7.5 years). The weighted average interest rate for the Group’s US dollar denominated xed rate borrowings is 3.6% (2015: 2.8%). The weighted average time for which the rates
are xed is 2.0 years (2015: 3.5 years). The weighted average interest rate for the Group’s other currency xed rate borrowings is 9.4% (2015: 9.6%). The weighted average time for which the
ratesare xed is 6.8 years (2015: 0.6 years).
2 At 31 March 2016 other borrowings of £1,554 million (2015: £1,314 million) include a £1.4 billion (2015: £1.3 billion) liability for payments due to holders of the equity shares in Kabel Deutschland
AG under the terms of a domination and prot and loss transfer agreement.
The gures shown in the tables above take into account interest rate swaps used tomanage the interest rate prole of nancial liabilities.
Interest on oating rate borrowings is generally based on national LIBOR equivalents or government bond rates in the relevant currencies.
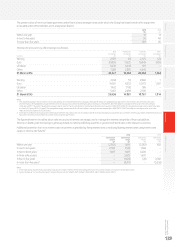
Additional protection from euro interest rate movements is provided by xing interest rates or reducing oating interest rates using interest rate
swaps or interest rate futures1.
2016 2015
Interest rate
futures
£m
Interest rate
swaps
£m
Interest rate
futures
£m
Interest rate
swaps
£m
Within one year (2,953) 1,696 (2,282) 655
In one to two years 2,700 1,518 1,659 –
In two to three years 1,607 1,429 3,000 –
In three to four years – 5,625 1,687 –
In four to ve years – (1,429) (20) 4,782
In more than ve years2– (2,411) –(5,258)
Notes:
1 In the table above, gures shown as positive indicate an increase in xed interest debt and gures shown in brackets indicate a reduction in xed interest debt.
2 Figures shown as “in more than ve years” relate to the periods from March 2021 to March 2022 (2015: March 2020 to March 2021).