United Healthcare 2001 Annual Report Download - page 50
Download and view the complete annual report
Please find page 50 of the 2001 United Healthcare annual report below. You can navigate through the pages in the report by either clicking on the pages listed below, or by using the keyword search tool below to find specific information within the annual report.-
 1
1 -
2
-
3
-
4
-
5
-
6
-
7
-
8
-
9
-
10
-
11
-
12
-
13
-
14
-
15
-
16
-
17
-
18
-
19
-
20
-
21
-
22
-
23
-
24
-
25
-
26
-
27
-
28
-
29
-
30
-
31
-
32
-
33
-
34
-
35
-
36
-
37
-
38
-
39
-
 40
40 -
 41
41 -
 42
42 -
 43
43 -
 44
44 -
 45
45 -
 46
46 -
 47
47 -
 48
48 -
 49
49 -
 50
50 -
 51
51 -
 52
52 -
 53
53 -
 54
54 -
 55
55 -
 56
56 -
 57
57 -
 58
58 -
 59
59 -
 60
60 -
61
-
62
 |
 |

PAGE 49 UnitedHealth Group
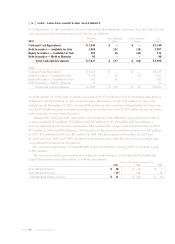
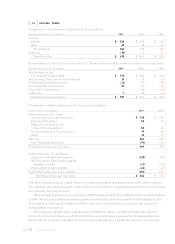
[6]CASH, CASH EQUIVALENTS AND INVESTM ENTS
As of December 31, the amortized cost, gross unrealized holding gains and losses, and fair value of cash,
cash equivalents and investments were as follows (in millions):
Amortized Gross Unrealized Gross Unrealized Fair
2001 Cost Gains Losses Value
Cash and Cash Equivalents $ 1,540 $ – $ – $ 1,540
Debt Securities — Available for Sale 3,806 121 (20) 3,907
Equity Securities — Available for Sale 201 16 (46) 171
Debt Securities — Held to Maturity 80 – – 80
Total Cash and Investments $ 5,627 $ 137 $ (66) $ 5,698
2000
Cash and Cash Equivalents $1,419 $ – $ – $1,419
Debt Securities — Available for Sale 3,198 89 (6) 3,281
Equity Securities — Available for Sale 201 61 – 262
Debt Securities — Held to Maturity 91 – – 91
Total Cash and Investments $4,909 $150 $(6) $5,053
As of December 31, 2001, debt securities consisted of $1,073 million in U.S. Government and Agency
obligations, $1,684 million in state and municipal obligations, and $1,230 million in corporate
obligations. At December 31, 2001, we held $306 million in debt securities with maturities less than one
year, $1,475 million in debt securities maturing in one to five years, and $2,206 million in debt securities
with maturities of more than five years.
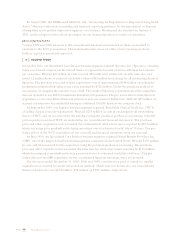
During 2001, 2000 and 1999, respectively, we contributed UnitedHealth Capital investments valued
at approximately $22 million, $52 million and $50 million to the UnitedHealth Foundation, a
non-consolidated, not-for-profit organization. The realized gain of approximately $18 million in 2001,
$51 million in 2000 and $49 million in 1999 was offset by the related contribution expense of $22 million
in 2001, $52 million in 2000 and $50 million in 1999. The net expense of $4 million in 2001 and
$1 million in both 2000 and 1999 is included in Investment and Other Income in the accompanying
Consolidated Statements of Operations.
In a separate disposition of UnitedHealth Capital investments during 2000, we realized a gain
of $27 million.
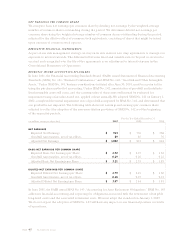
We recorded realized gains and losses on the sale of investments, excluding the UnitedHealth
Capital dispositions described above, as follows (in millions): For the Year Ended December 31,
2 0 0 1 2000 1999
Gross Realized Gains $ 30 $12 $9
Gross Realized Losses (19) (46) (15)
Net Realized Gains (Losses) $11 $(34) $(6)