United Healthcare 2001 Annual Report Download - page 29
Download and view the complete annual report
Please find page 29 of the 2001 United Healthcare annual report below. You can navigate through the pages in the report by either clicking on the pages listed below, or by using the keyword search tool below to find specific information within the annual report.-
 1
1 -
2
-
3
-
4
-
5
-
6
-
7
-
8
-
9
-
10
-
11
-
12
-
13
-
14
-
15
-
16
-
17
-
18
-
 19
19 -
 20
20 -
 21
21 -
 22
22 -
 23
23 -
 24
24 -
 25
25 -
 26
26 -
 27
27 -
 28
28 -
 29
29 -
 30
30 -
 31
31 -
 32
32 -
 33
33 -
 34
34 -
 35
35 -
 36
36 -
 37
37 -
 38
38 -
 39
39 -
40
-
41
-
42
-
43
-
44
-
45
-
46
-
47
-
48
-
49
-
50
-
51
-
52
-
53
-
54
-
55
-
56
-
57
-
58
-
59
-
60
-
61
-
62
 |
 |

UnitedHealth Group
PAGE 28
Income Taxes
The 2000 income tax provision includes nonrecurring tax benefits primarily related to the contribution
of UnitedHealth Capital investments to the UnitedHealth Foundation. Excluding nonrecurring tax
benefits, our effective income tax rate was 37.5% in 2000 and 37.0% in 1999.
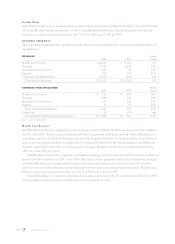
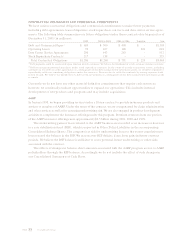
BUSINESS SEGMENTS
The following summarizes the operating results of our business segments for the years ended December 31
(in millions):
REVENUES
Percent
2000 1999 Change
Health Care Services $18,696 $17,581 6%
Uniprise 2,140 1,865 15%
Specialized Care Services 974 726 34%
Ingenix 375 258 45%
Corporate and Eliminations (1,063) (868) nm
Consolidated Revenues $21,122 $19,562 8%
EARNINGS FROM OPERATI ONS
Percent
2000 1999 Change
Health Care Services $739 $578 28%
Uniprise 289 222 30%
Specialized Care Services 174 128 36%
Ingenix 32 25 28%
Total Operating Segments 1,234 953 29%
Corporate (34) (10) nm
Consolidated Earnings from Operations
$
1,200 $943 27%
nm — not meaningful
Health Care Services
The Health Care Services segment posted revenues of $18.7 billion in 2000, an increase of $1.1 billion,
or 6%, over 1999. This increase was primarily due to premium yield increases on UnitedHealthcare’s
renewing commercial insured business and growth of approximately 7% in the number of individuals
served in continuing markets, partially offset by targeted pullbacks in certain geographic and Medicare
markets. Adjusted for the effects of these market changes, Health Care Services’ revenues increased by
10% on a year-over-year basis.
The Health Care Services segment contributed earnings from operations of $739 million in 2000, an
increase of $161 million, or 28%, over 1999. This increase was primarily the result of improved margins
on UnitedHealthcare’s commercial business and lower operating costs as a percentage of revenues,
driven by process improvement, technology deployment and cost management initiatives. Health Care
Services’ operating margin increased to 4.0% in 2000 from 3.3% in 1999.
UnitedHealthcare’s commercial medical care ratio improved to 84.1% in 2000 from 84.6% in 1999,
as net premium yield increases exceeded increases in medical costs.